
Aroon Indicator for MT5
Aroon indicator is the perfect tool to measure the momentum and strength of a trend
Grátis · Sem cadastro obrigatório
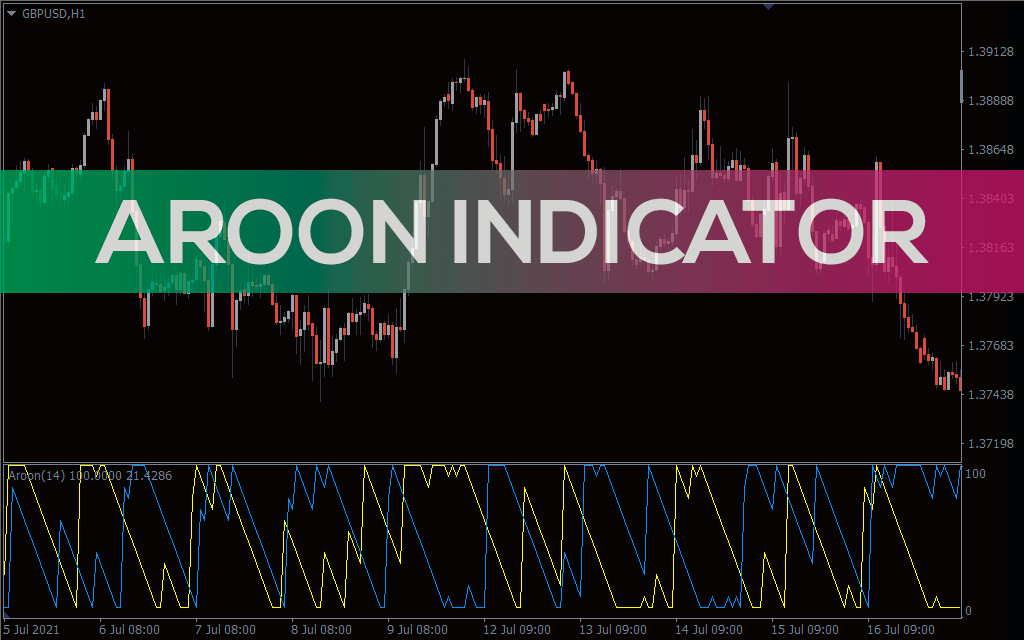
Aroon indicator for MT5 is a relatively lesser known indicator. However, this does not mean that it is less powerful. It's just indicators, if not better. Tushar Chande developed the indicator in 1995. In fact, the free Aroon indicator for MT5 is designed to determine the type of trend in the market (upward, downward or sideways). It also measures the strength of a trend and informs traders of a potential price reversal. Moreover, it helps traders to identify consolidation and corrective correction in the market. How the Aroon indicator works The indicator consists of Aroon up and Aroon down. Aroon up measures the value of an uptrend, while Aroon down measures a downtrend in the market. The two lines help traders identify price action and anticipate buying and selling pressure in the market by measuring the meaning of uptrend and downtrend in the market. The indicator draws an oscillator on price charts with values \ \ from 0 to 100, with two curves fluctuating between the values. For example, if an up Aroon is above a Down Aroon, it signals an uptrend. Similarly, when the Aroon crosses the 50 value market, it is a clear sign of a strong uptrend. This scenario is confirmed by Aroon falling below level 30. Similarly, when Aroon is down above 50, the downtrend is strong. This signal is further strengthened by the ascending line near the zero mark. However, when both lines are in close proximity, it is a clear sign that the market is consolidating. When the line is near the 100 level, the trend is well established and strong. However, when it crosses 30 markets towards zero, the trend becomes an exit and possibly moves towards a reversal. Chart Example The above chart shows the price movement of the Euro against the New Zealand Dollar. Notice how the descending blue line of Aroon settles around the 100 mark, in the area circled in red. The rising Yellow line remains near the 0 range. The fact that the blue line is near 100 means that the downtrend is strong. The price action confirms that the indicator signal is correct. The price maintains a steady downtrend by the red arrow. Similarly, during a strong uptrend, the rising yellow line stays around 100 while the blue line oscillates around 0 in the green circled area. In fact, the price establishes a steady uptrend in accordance with the signal of the indicators. Conclusion This is an ideal indicator for moving with the trend. It can also help you measure the momentum of a trend and predict an impending price reversal. Don't take our word for it. Come on, try it.
3 Color MACD Indicator for MT5
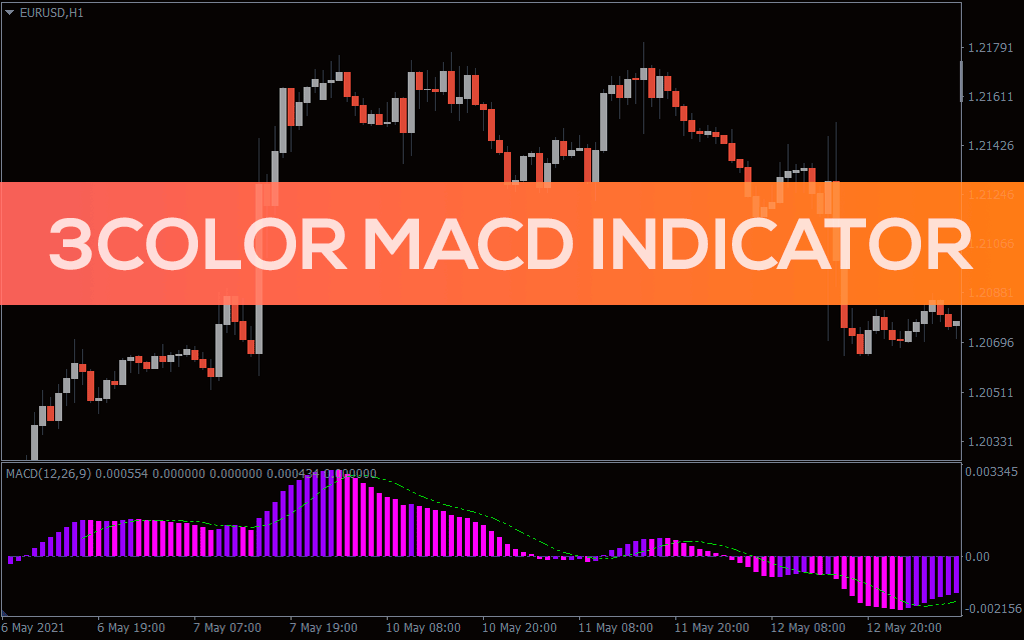
3 Colored MACD Histogram Indicator for MT5 Best forex trading indicator with MACD lines and histogram
3TF RSI Average Indicator for MT5
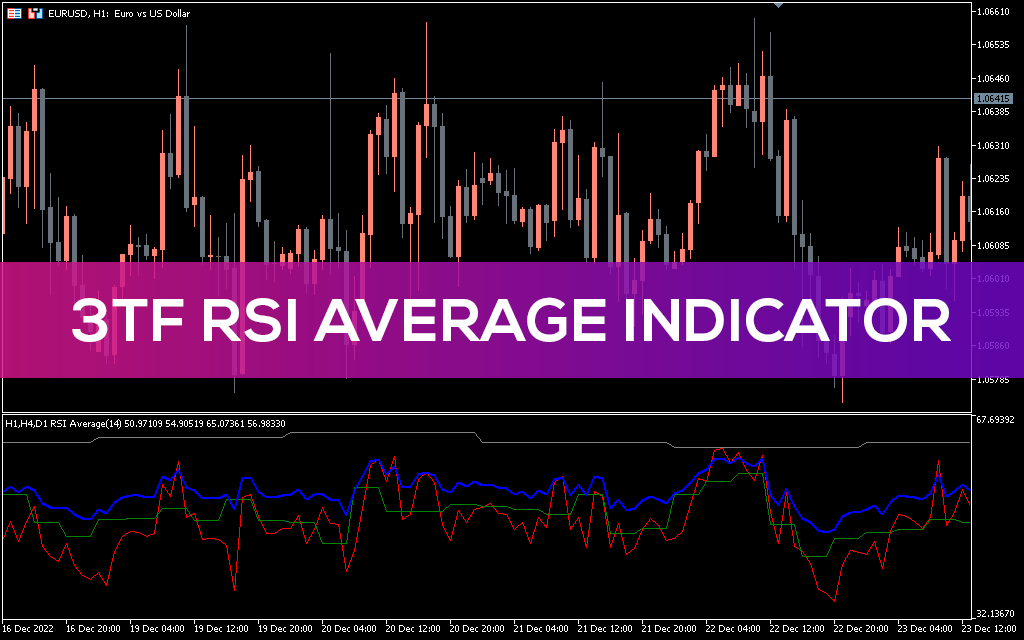
3TF RSI Average MT5 Indicator it is great trading tool to combine RSI and multitimeframe methods
4 MA Strength Indicator for MT5
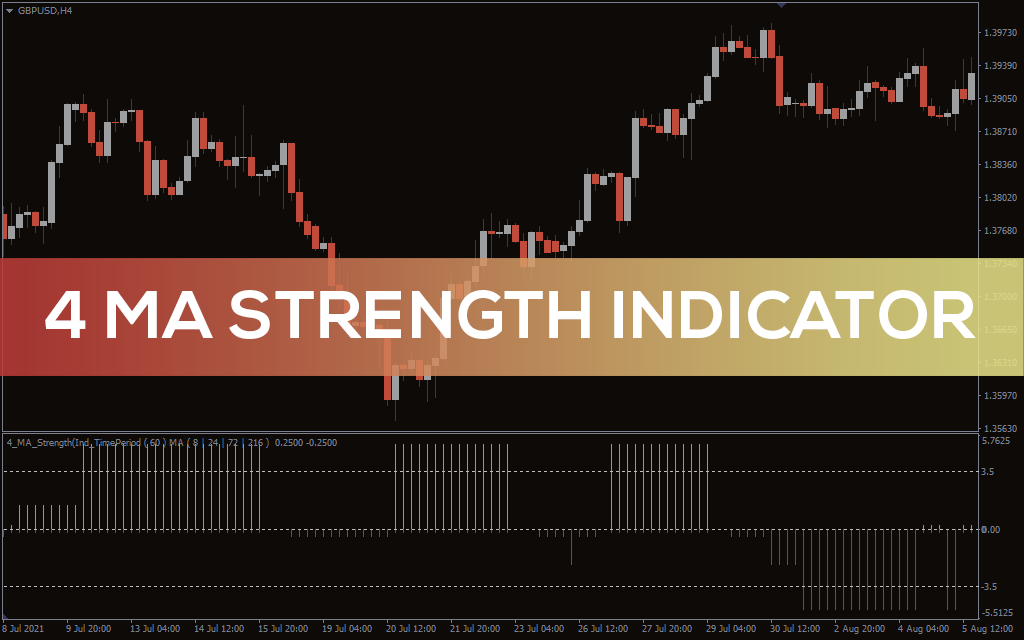
Forex BUY, SELL signals from the best 4-MA strength indicator
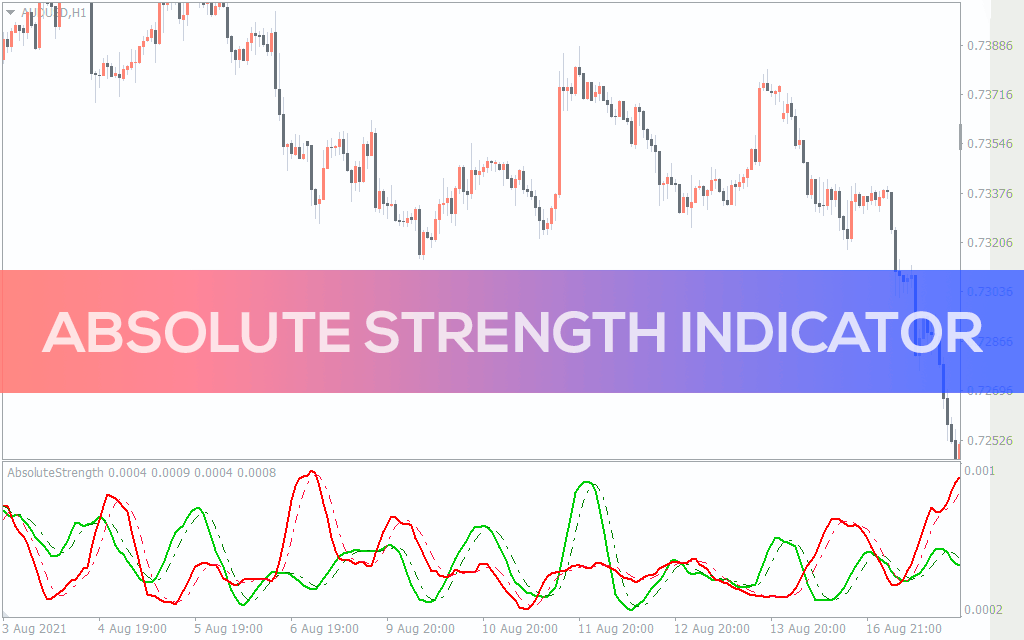
Absolute Strength Indicator for MT5
Absolute Strength Indicator for MT5 gives you BUY and SELL trading signals and trend strength
Informações