
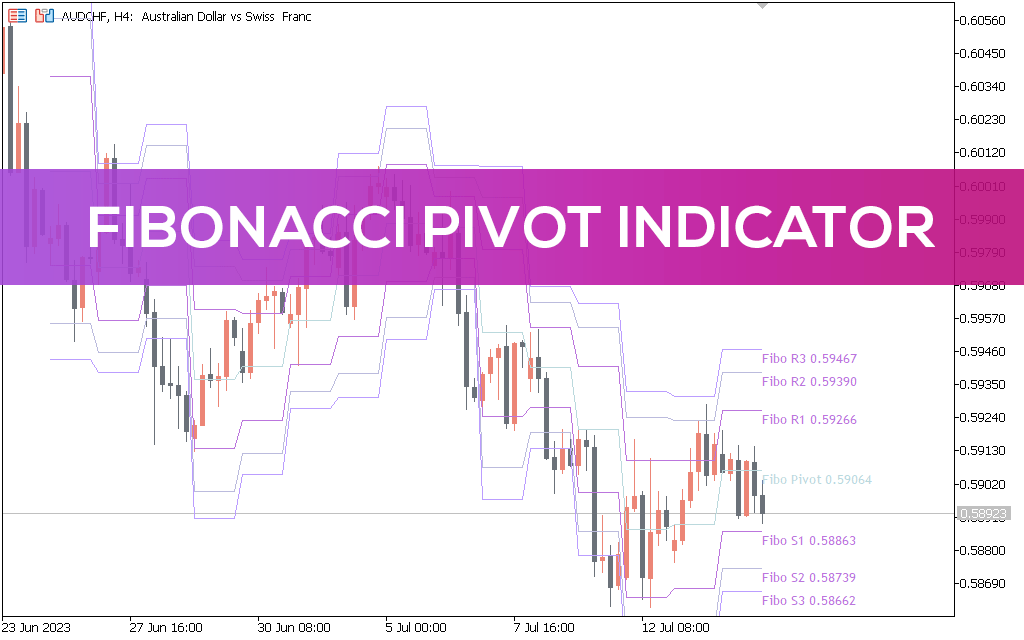
Fibonacci Pivot Indicator for MT5
Get this best MT5 indicator to automatically calculate support and resistance with 3 profit targets using Fibonacci and
Grátis · Sem cadastro obrigatório
For beginners and experienced traders, it is extremely important to find the best support and resistance levels. Traders make extensive use of pivot levels to understand current price trends. Combining pivot levels with Fibonacci ratios allows traders to identify strong support and resistance levels. The Fibonacci Pivot indicator provides stop loss and multiple take profit points. It allows the trader to monitor markets after a trend has been established. Most traders start the day by identifying support and resistance levels and then use other indicators to test them. The Fibonacci Reversal Level Indicator for MT5 helps traders find the best support and resistance levels automatically. Determining the potential trend of the day is another important task. Pivot points are calculated using the previous day's high, low and close divided by three. If prices are below the last day's pivot, the trend is considered bearish. Intraday traders tend to look for a bullish price action if the current price remains above the reversal level. Beginners and experienced alike appreciate Fibonacci numbers and their effectiveness in Forex trading. Traders use Fibonacci numbers applied to a pivot point to determine the best support and resistance levels. Also in trading, market participants use the Fibonacci ratios of 38.2, 61.8 and 76.4 to calculate three different levels of resistance and support. How to trade the Fibonacci Pivot indicator for Metatrader? If the price crosses the reference level up, a BUY position is opened. The resistances R1, R2 and R3 form the take profit targets 1, 2 and 3 respectively. Traders can expect partial profits at these levels. Stop loss is placed below the S1 support. If the price moves towards R1, stops can be moved to breakeven. If the price continues to rise and reaches R2, then the stop can be moved to R1 and then moved to R2 and R3 price moves further. Below is the formula for calculating the pivot point and support and resistance levels: Pivot = (Previous High+Previous Low+Previous Close)/3 Resistance 1 = Pivot +(Previous High-Previous Low)*0.382 Support 1 = Pivot-(Previous High-Previous Low)*0.382 Resistance 2 = Pivot+(Previous High-Previous Low)*0.618 Support 2 = Pivot-(Previous High-Previous Low)*0.618 Resistance 3 = Pivot+(Previous High-Previous Low)*0.764 Support 3 = Pivot-(Previous High-Previous Low)*0.764 Limits Reversals are calculated using the previous day's data, market dynamics may change and may not necessarily follow the trend indicated by the reversal. Support and resistance levels are based on Fibonacci numbers and represent a mathematical value. Output Both indicators provide support and resistance strength; however, additional confirmation using price action is required for successful trading.
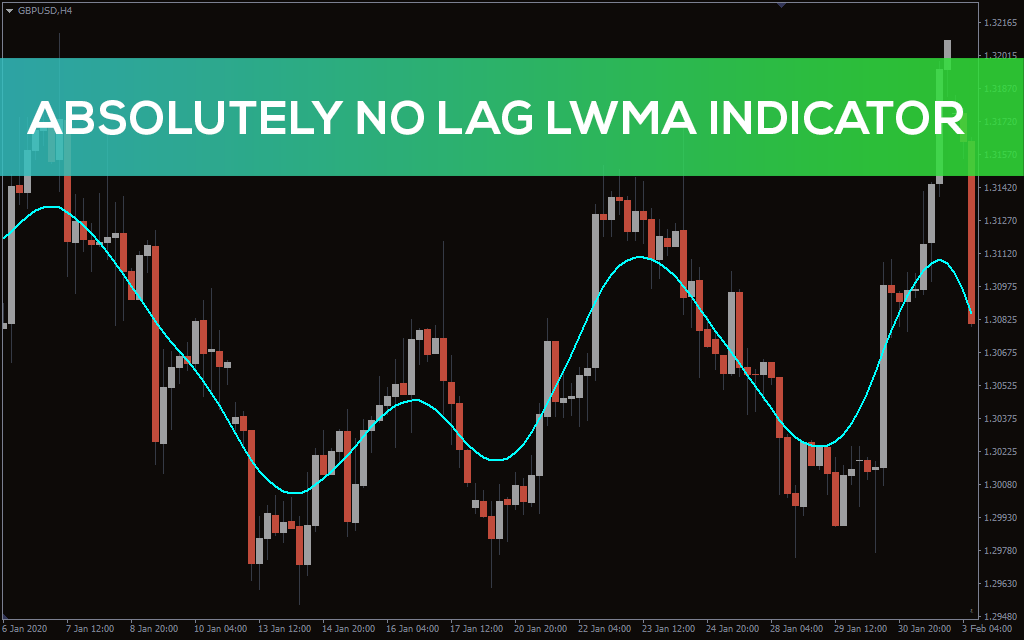
Absolutely No Lag LWMA Indicator for MT5
The best Absolutely No Lag LWMA moving average indicator for identifying correct market trends on MTF MT5 charts
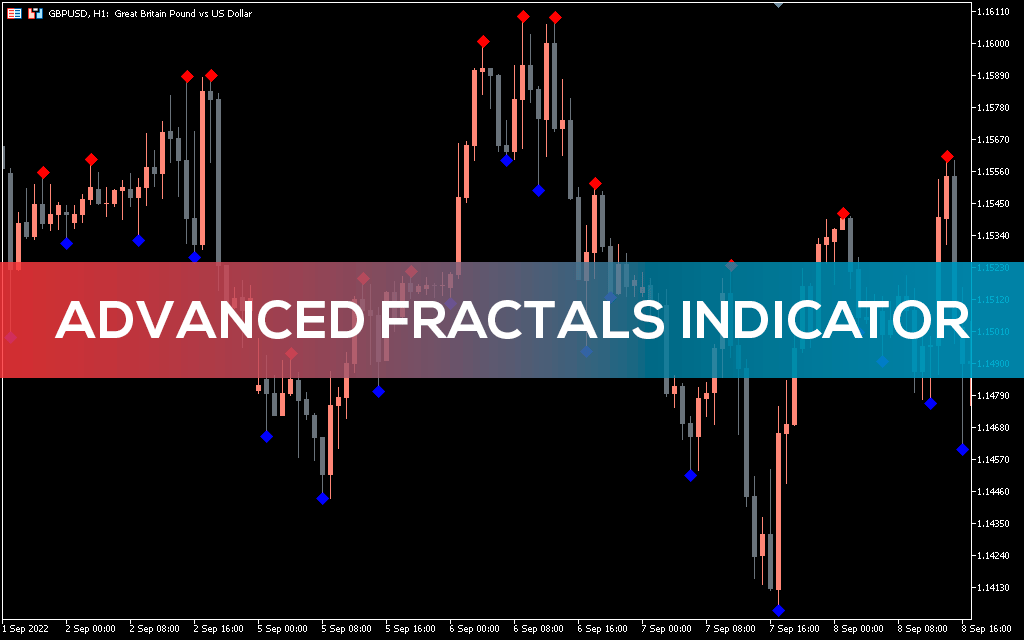
Advanced Fractals Indicator for MT5
Learn about the best ways to use Advanced fractals signals for profitable Forex trading
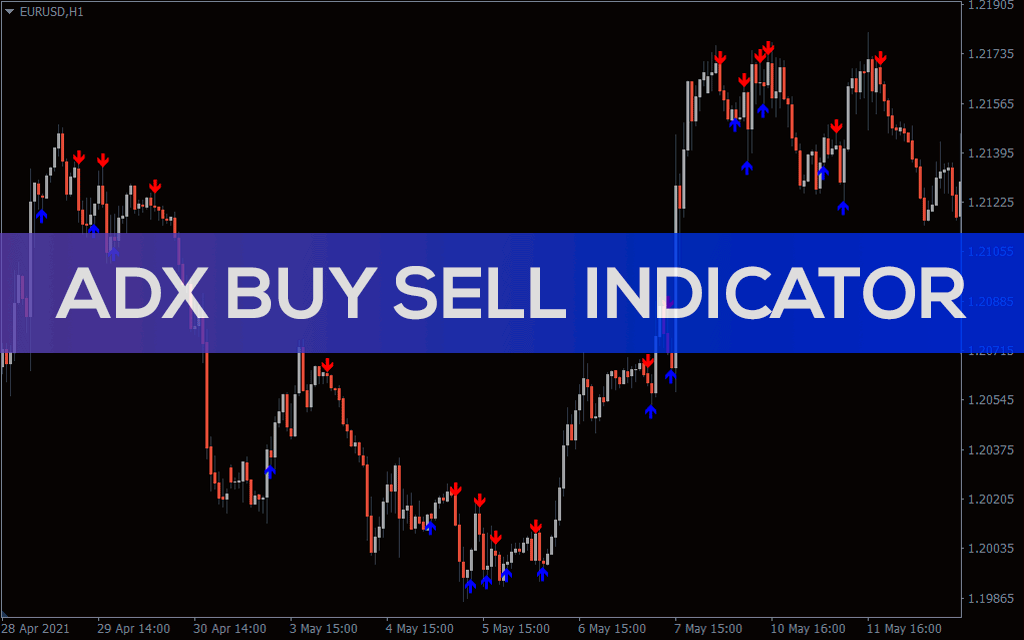
ADX Buy Sell Indicator for MT5
ADX Buy Sell MT5 forex trading indicator
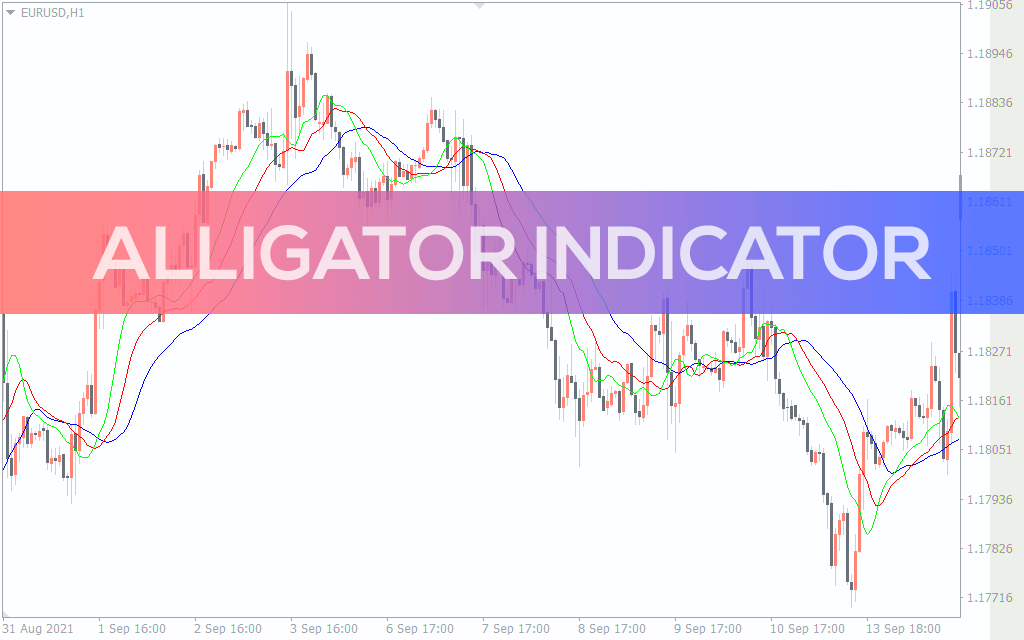
Alligator Indicator for MT5
Alligator is one of the best alternatives for moving average indicators
Informações