
MACD Divergence Indicator
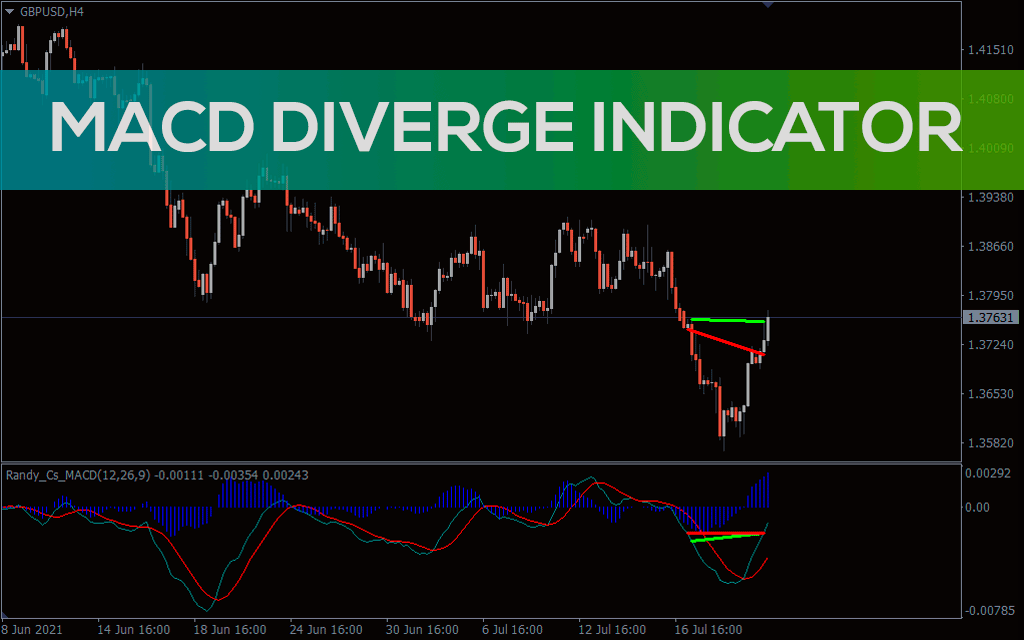
The MACD Divergence Indicator for MT4 helps traders spot any divergence between the price and the MACD indicator.
Grátis · Sem cadastro obrigatório
Divergence in the forex market is the best tool to identify upcoming trend continuation or reversal. Divergence occurs when the oscillator and the price are moving in a dissimilar way. The best oscillator to use for spotting divergence is the MACD Divergence Indicator. The foundation The MACD Divergence Indicator for MT4 helps traders spot any deviation between the price and the MACD. This indicator contains a volume histogram EMA and 25 EMA. The MACD volume histogram shows the trend strength and direction. Consequently, the 12 and 25 EMA of the MACD are used to identify trend reversals. The MACD Divergence Indicator for MT4 can spot both regular and hidden divergence. Advanced traders use this indicator to enter less risky, more rewarding trades. This indicator is also the best tool to recognize a trend reversal or continuation early. How to spot a Divergence using MACD Divergence Indicator Divergence is typically divided into two – regular and hidden divergence. A regular Divergence detects a trend reversal while a hidden divergence signals trend continuation. A bullish regular divergence creates a higher low MACD, while the price makes lower lows. Contrarily, a bearish regular divergence creates a lower high MACD while the price makes a higher high. A bullish hidden divergence creates a lower low MACD price makes a higher low. Finally, a bearish hidden divergence creates a higher high MACD while the price makes a lower high. How to use the MACD Divergence Indicator to place trades Bullish regular divergence indicates the end of a downtrend and the beginning of an uptrend. Thus, the bullish regular divergence is a signal to buy. Bearish regular divergence indicates the beginning of an uptrend downtrend has ended. Therefore, a bearish regular divergence is a signal to sell. Also, a hidden bearish divergence signifies the continuation of an uptrend, and it’s a signal to go long. The EUR/USD H4 chart below shows how to enter and exit the trades using this indicator. A bullish hidden divergence was formed between the price and the indicator between March 1 to 9, 2021. This divergence was indicated with red trendlines on the chart and indicator. Thus, the MACD Divergence Indicator signaled that an uptrend was imminent. Also, a bullish engulfing candle was formed on March 9, 2021. A buy trade was confirmed when the fast 12 EMA crossed the slow 25 EMA upward. To manage the risk, a stop loss was placed a little below the recent swing low (1.1823). The buy trade was closed when the fast 12 EMA crossed the slow 25 EMA downward. Also, on the chart, a regular bearish divergence was formed between March 4 to 12, 2021. This divergence was indicated with green trendlines on the chart and indicator. The Indicator thus signaled that a downtrend was imminent. Furthermore, a doji was formed on March 12, 2021, signifying that bulls were exhausted. A sell position was confirmed when the fast 12 EMA crossed the slow 25 EMA downward. To manage the sell trade risk, the SL was placed a little higher than the recent swing high (1.2001). A partial profit can be taken around 1.1823. The trade was closed around 1.1707 (when the fast 12 EMA crossed the slow 25 EMA downward). Conclusion The MACD Divergence Indicator for MT4 helps forex traders spot divergences between the price and the MACD. This indicator can be used solely or combined with other price action. For best results, traders should use this indicator on H1, H4 and daily time frames.
1-2-3 Pattern Indicator
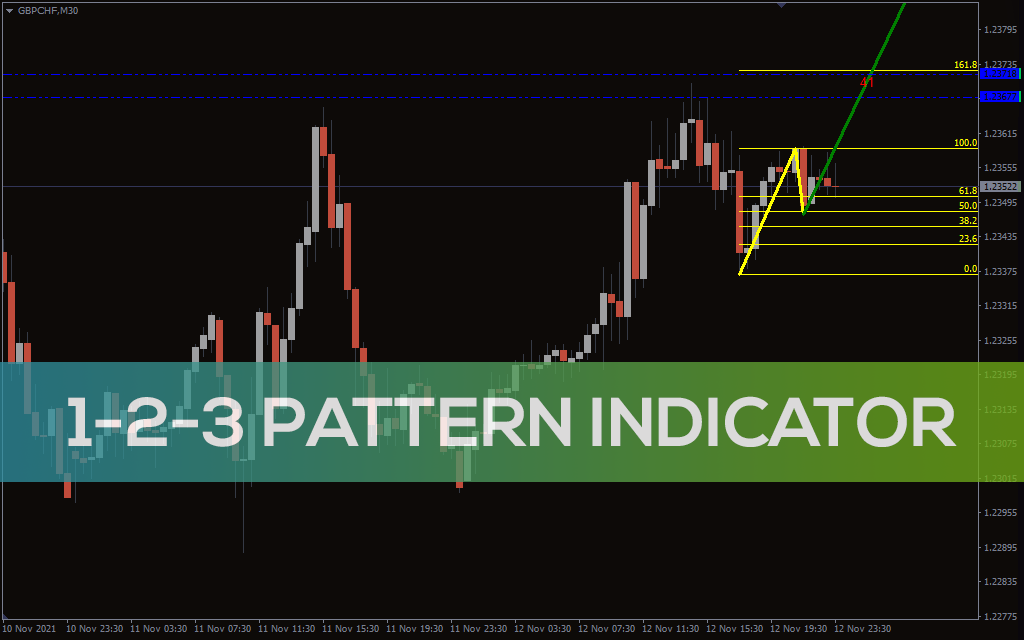
Baixe o indicador Padrão 1-2-3 gratuitamente. Descubra a tendência do mercado com os cinco indicadores Padrão 1-2-3 de nível Fibonacci.
100 Pips Indicator
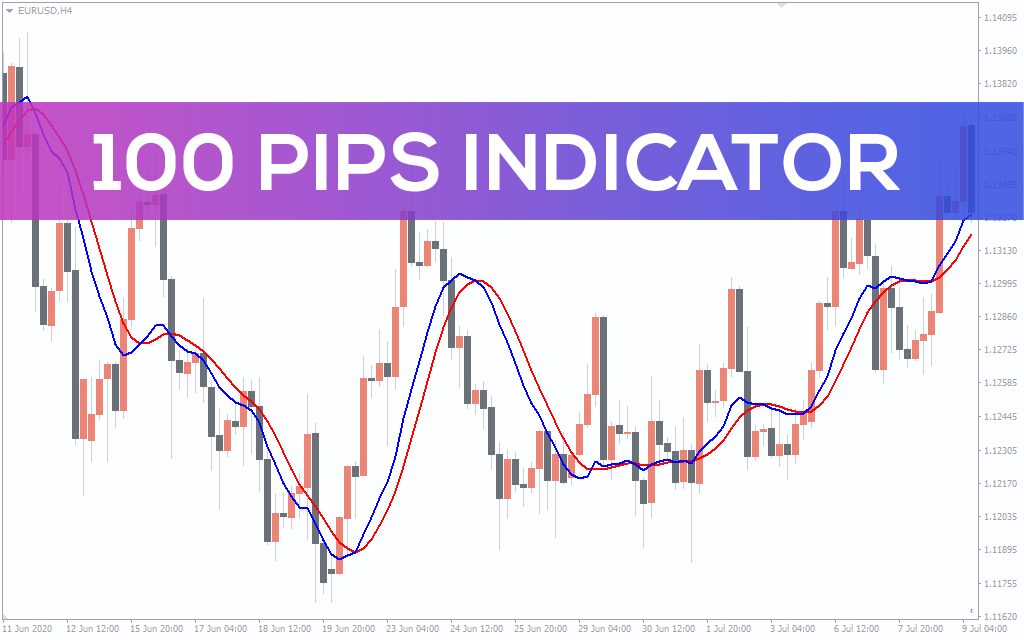
Um indicador de sinal de COMPRA VENDA de acompanhamento de tendências para comerciantes forex e de ações/intradiários. Adequado para gráficos MTF e todos os tipos de estilos de negociação no MT4. Baixe grátis.
3 Level ZZ Semafor Indicator
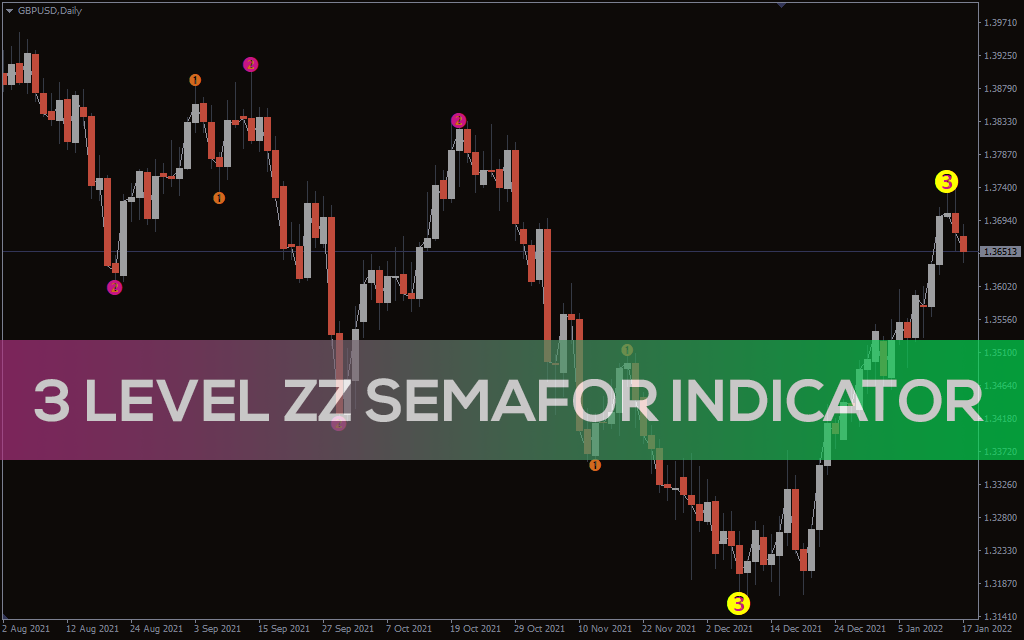
Sinais Forex BUY SELL do melhor MT4. Indicador ZZ Semafor de 3 níveis. Baixar grátis. Indicador de tendência em ziguezague.
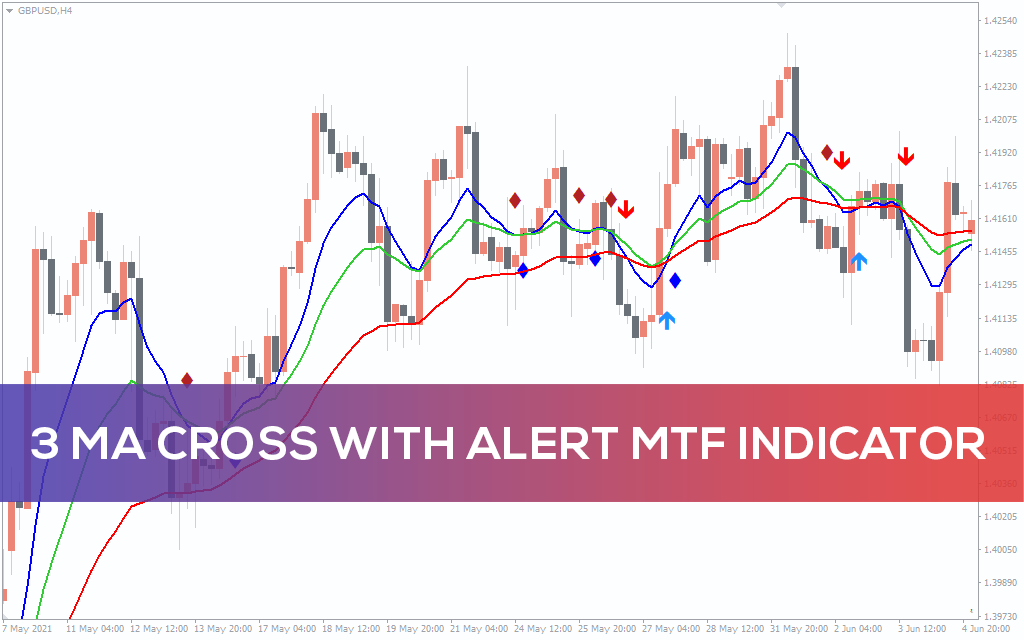
3 MA Cross with Alert MTF Indicator
Sinais Forex BUY SELL do melhor 3-MA Cross com Alert MTF Indicator. Baixar grátis. Encontre cruzamentos de alta e baixa. Indicador de tendência preciso.
Informações