
Patterns On Chart Indicator for MT5
Trade the best price action settings using Patterns On Chart on MTF MT5 charts
Grátis · Sem cadastro obrigatório
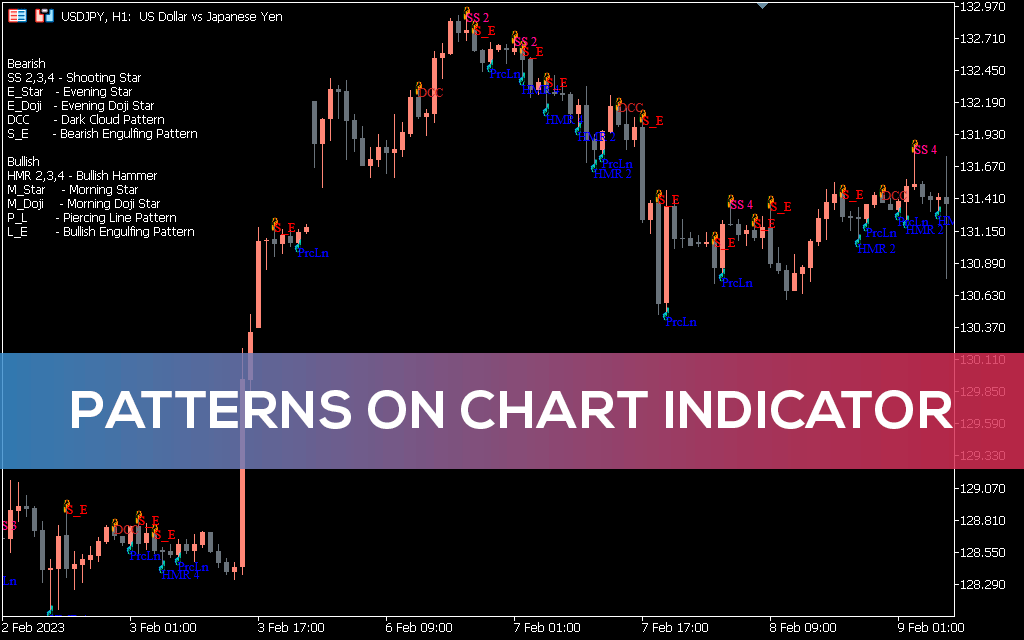
Patterns On Chart is an automatic candlestick pattern detection indicator for MT5. It helps beginners become familiar with price structures and understand how they work in the financial trading markets. In addition to displaying high-low prices and open-close prices, the candlestick structure also reflects the mood of the market. Traders use candlestick charts to predict potential price movement based on historical trends. When using the indicator, you do not need to remember all the names and constructions of patterns. The indicator automatically scans after the close of each candle and shows detailed information about the potential candle pattern. This interactive trading guide explains how to best trade forex and stocks with the Patterns On Chart indicator for MT5. How to use the Patterns On Chart Indicator in MT5 A Japanese candlestick means a display of price movement over a given period of time. By accurately showing price action, they offer useful information such sentiment or potential market reversals. Patterns On Chart will show you all chart patterns found in the last 200 bars. However, it does not filter trend following signals. Thus, you may need to add a trend indicator in order to place trades within the current market momentum. In the USD/JPY daily chart above, we have added a 10-day simple moving average to gauge market movement. Thus, once the price breaks the 10-SMA, we may decide to only choose buy signals in line with the bullish trend. As you can see, every time we triggered buy orders based on bullish candlestick patterns above the moving average, we made a successful rally. Although there is no specific rule not to go against the trend. With Patterns On Chart, you can also anticipate counter trading signals. For example, the chart depicts a bearish engulfing pattern that cannot go beyond a significant resistance level. This means that the price has lost its bullish momentum and it is time to activate sell orders. Conclusion Over the past few decades, candlestick charts have become more common in trading than any other technical analysis tool. Candlestick charts are at first sight more detailed than bar charts and line charts, and have a concise and easy-to-analyze look. Apply the Patterns On Chart indicator on your MT5 platform and start experiencing the thrill of price action trading.
3 Color MACD Indicator for MT5
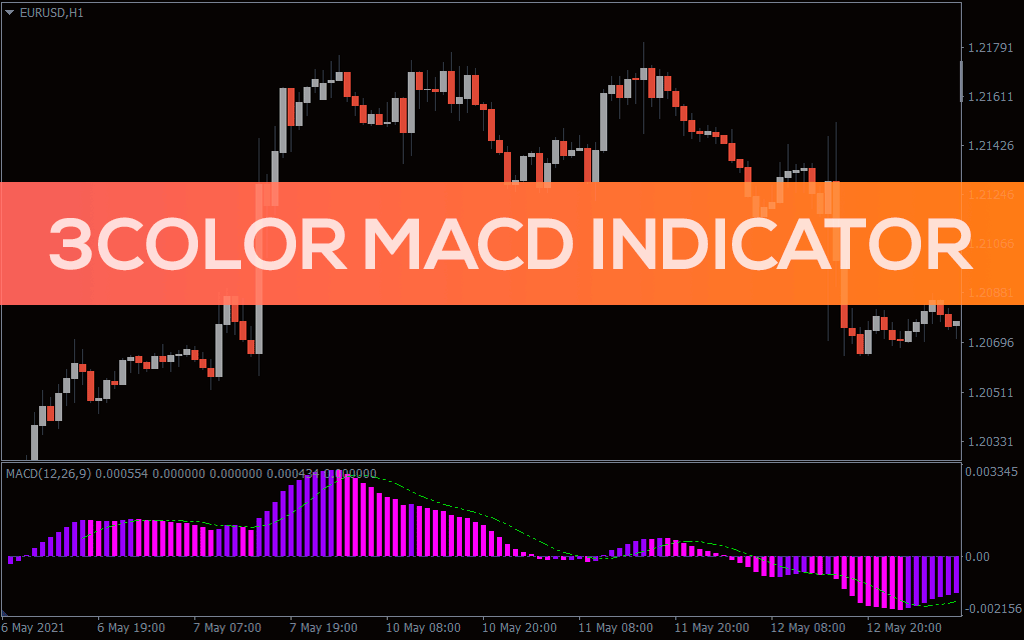
3 Colored MACD Histogram Indicator for MT5 Best forex trading indicator with MACD lines and histogram
3TF RSI Average Indicator for MT5
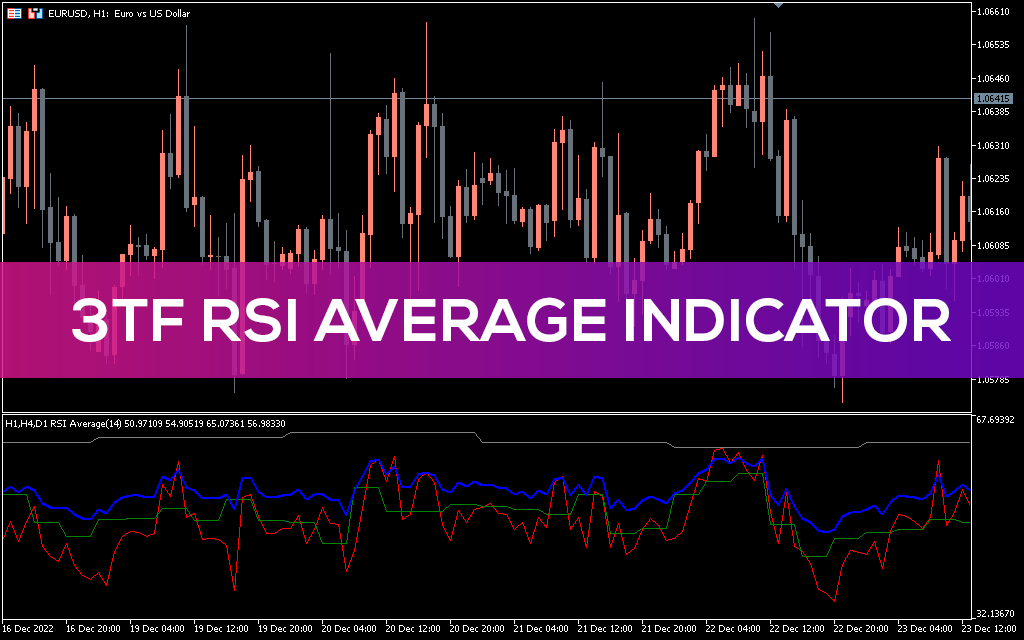
3TF RSI Average MT5 Indicator it is great trading tool to combine RSI and multitimeframe methods
4 MA Strength Indicator for MT5
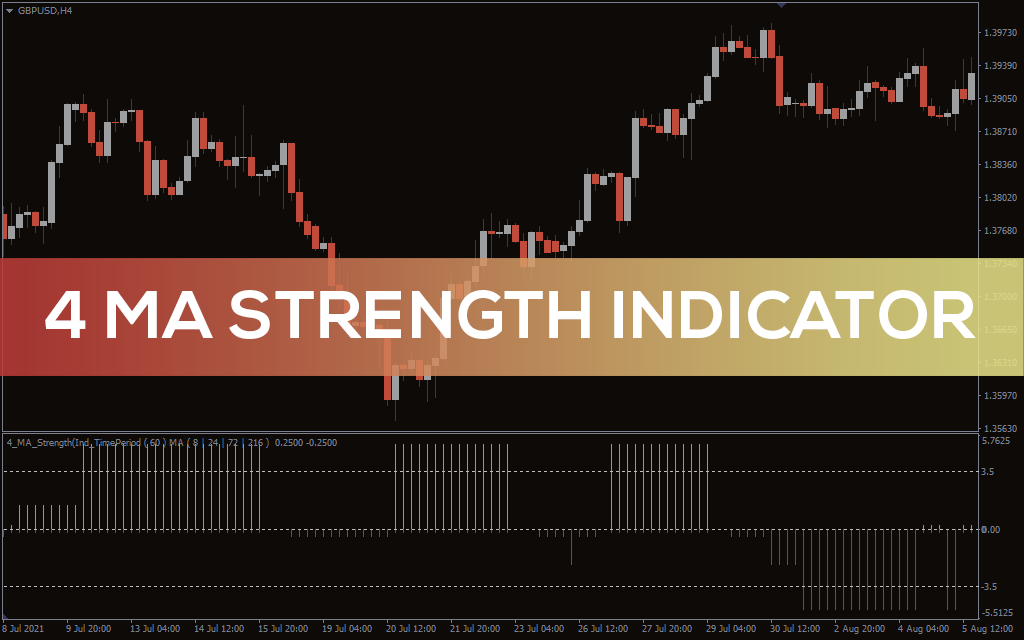
Forex BUY, SELL signals from the best 4-MA strength indicator
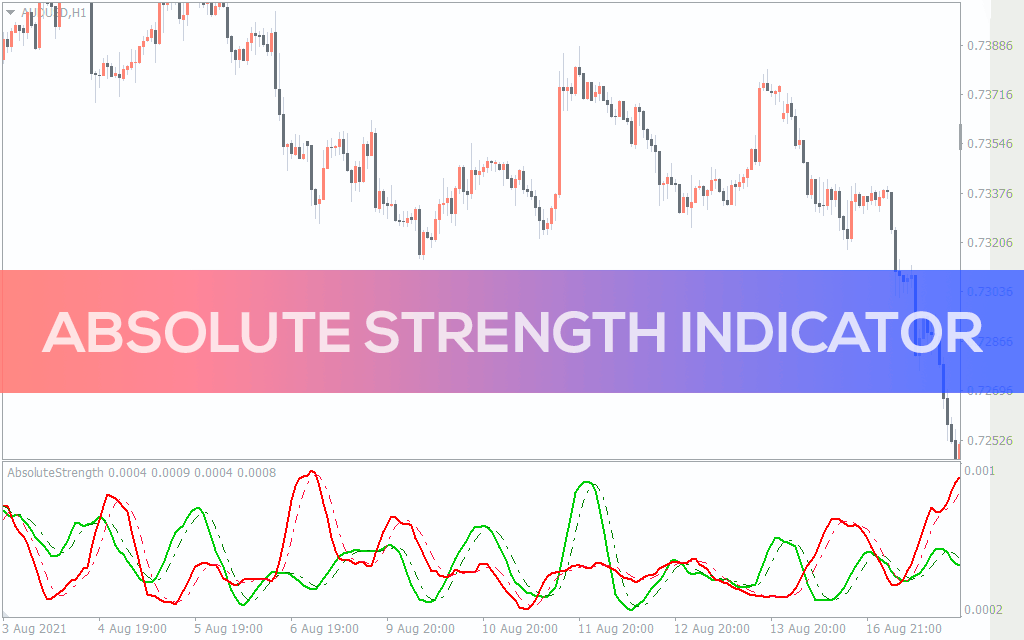
Absolute Strength Indicator for MT5
Absolute Strength Indicator for MT5 gives you BUY and SELL trading signals and trend strength
Informações