
RSI on MA Indicator
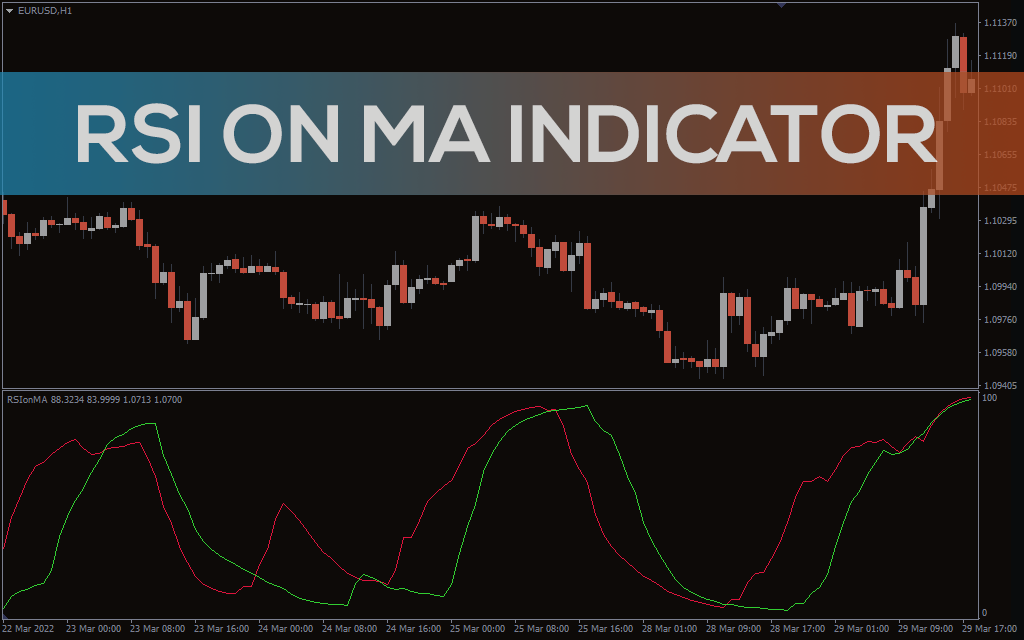
A technical RSI on MA indicator that detects trend reversals and changes in momentum. It is an ideal free trend following tool.
Grátis · Sem cadastro obrigatório
One of the popular techniques of trading with the trend is using Moving Average crossovers. The RSI on MA crossover uses MA crossover but incorporates another powerful tool, the Relative Strength Index (RSI). The technical indicator draws two lines that oscillate between 0 and 100. Buying and selling signals appear depending on the interaction of the two lines. It does show not only the trend but also the momentum. You can use the indicator to trade any currency pair. It also works well on metals, commodities, and stocks. In addition, you can use it to identify long-term and short-term trends. This means you can plot the lines in any time frame. Trading Signals As the name suggests, the indicator uses the Relative Strength Index (RSI) of moving averages. The crimson RSI line represents a faster-moving average, while the lime green lime represents a slower moving average. Buy Signal – The indicator gives a buy signal when the crimson line crosses above the lime green line. It also signifies the momentum is rising. Set the stop loss below the entry candle or the swing low. Sell Signal – The technical trading tool gives a sell signal when the crimson line crosses below the lime green line. This is also an indication that momentum is declining. Place the stop loss several pips above the entry candle or the swing high. Trading Example The indicator shows the price chart for the Euro against the US dollar in a one-hour timeframe. The crimson line crosses below the lime green line indicating a bearish signal. The market moved over 100 pips after the indicator posted the sell signal. You must close the trade to prevent the trade from eating into your profits after reversal. The ideal time to exit is when the crimson line crosses below the green line or at the next resistance level. Similarly, the indicator gives a buy signal when the crimson line cross above the lime green line. After the lines crossover, the market moved over 70 pips. Ride the trend until the next crossover or at the support level. The important point is that the crossover gives a market entry signal and effectively invalidates the previous signal. Conclusion The RSI on the MA indicator can identify the market trend and momentum. Simply trade the line crossover. While you can use it standalone indicator, it works well with other strategies. Include other trend-following technical tools to establish confluence and refine the accuracy of the signals.
1-2-3 Pattern Indicator
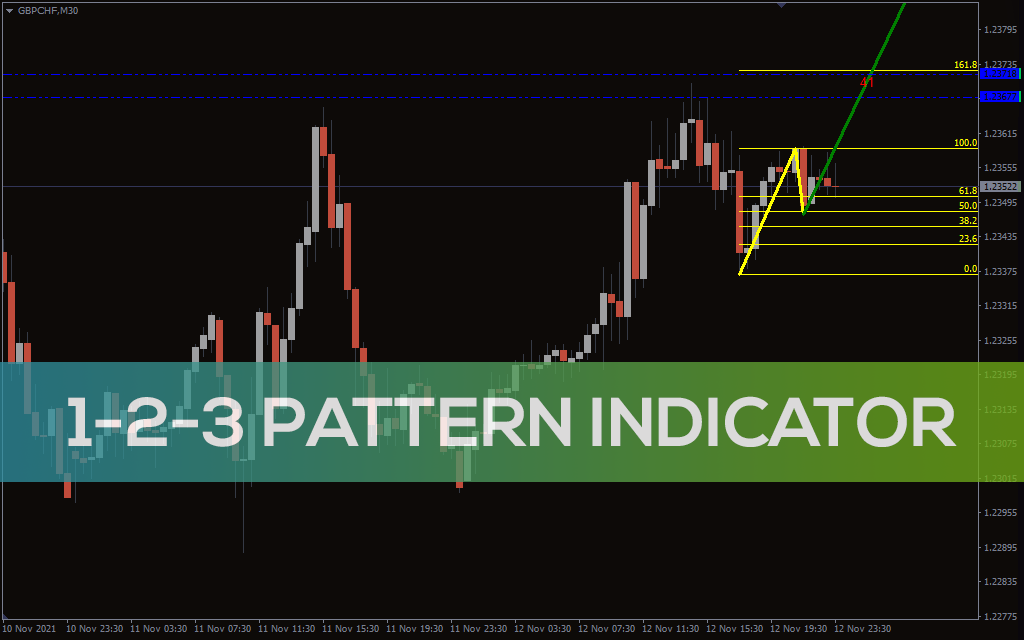
Baixe o indicador Padrão 1-2-3 gratuitamente. Descubra a tendência do mercado com os cinco indicadores Padrão 1-2-3 de nível Fibonacci.
100 Pips Indicator
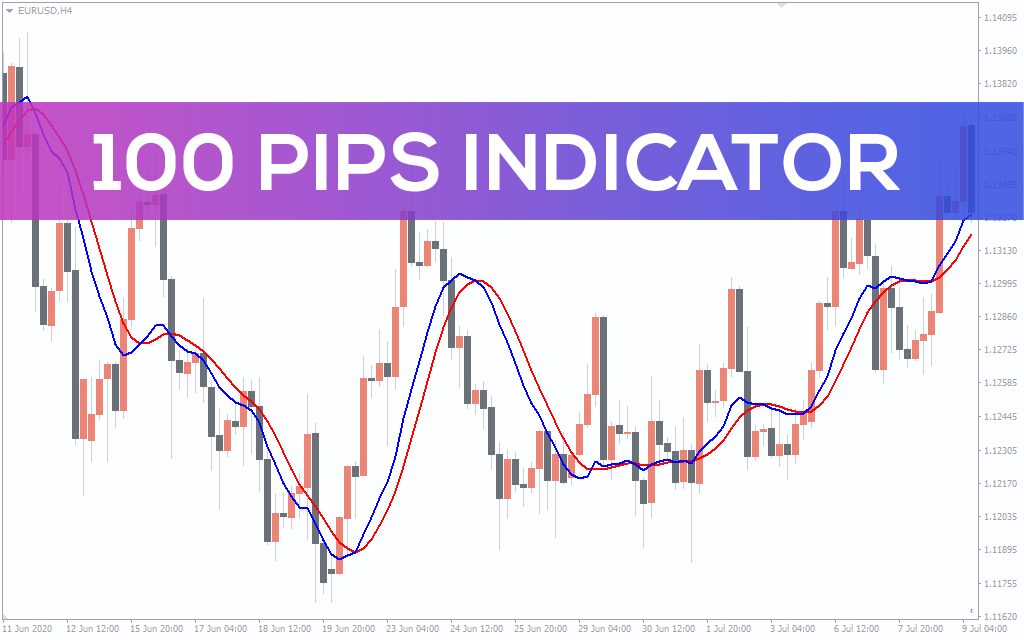
Um indicador de sinal de COMPRA VENDA de acompanhamento de tendências para comerciantes forex e de ações/intradiários. Adequado para gráficos MTF e todos os tipos de estilos de negociação no MT4. Baixe grátis.
3 Level ZZ Semafor Indicator
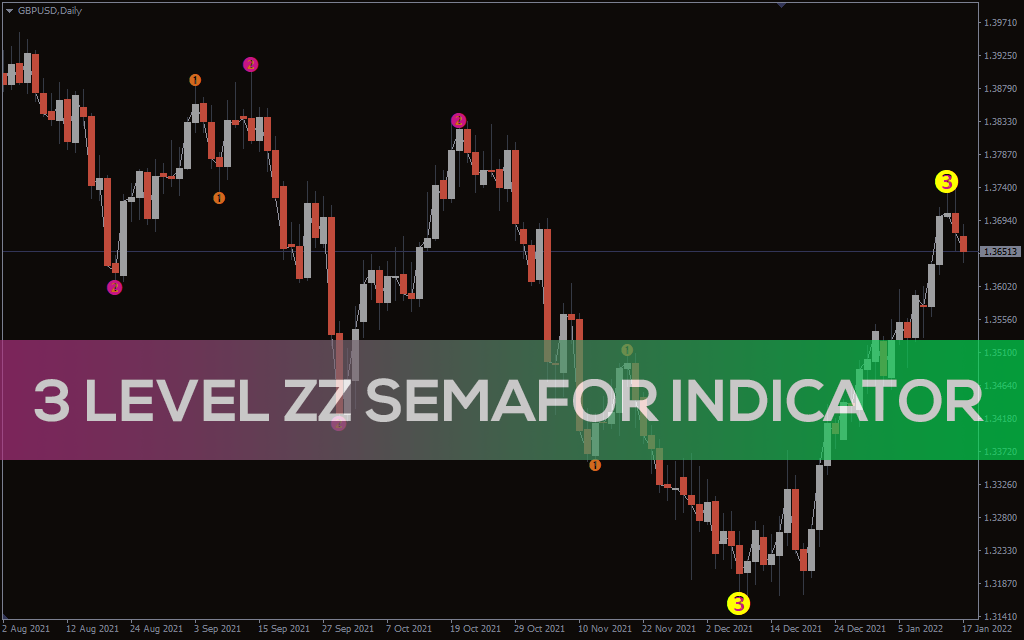
Sinais Forex BUY SELL do melhor MT4. Indicador ZZ Semafor de 3 níveis. Baixar grátis. Indicador de tendência em ziguezague.
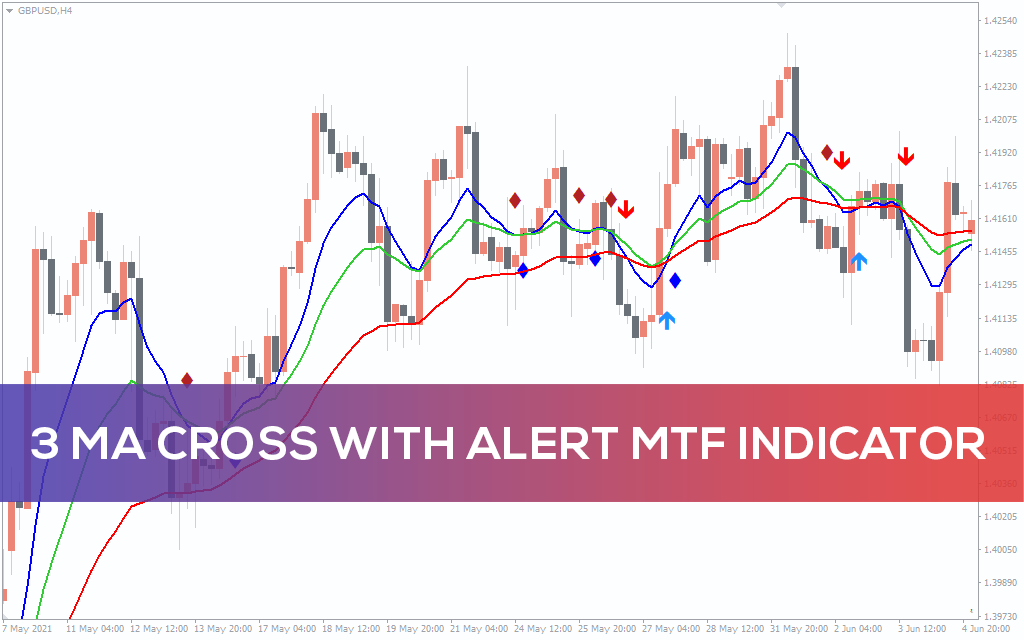
3 MA Cross with Alert MTF Indicator
Sinais Forex BUY SELL do melhor 3-MA Cross com Alert MTF Indicator. Baixar grátis. Encontre cruzamentos de alta e baixa. Indicador de tendência preciso.
Informações