
Sideways Detector Indicator
Sideways Detector is the best MT4 indicator for anticipating breakout trading signals with higher probabilities. Suits forex, stocks, commodities & cryptocurren
Grátis · Sem cadastro obrigatório
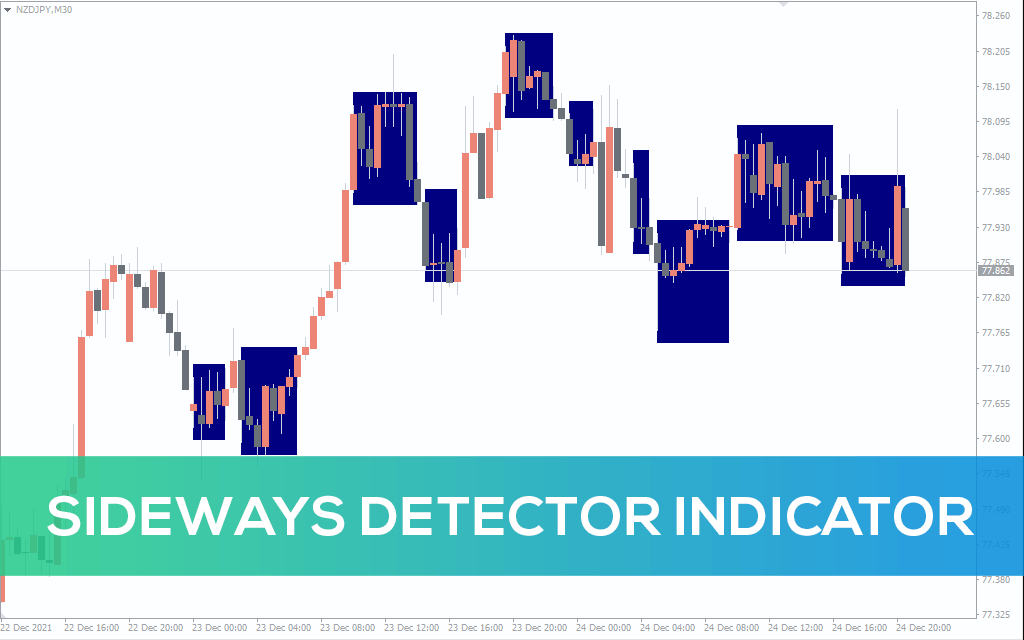
The Sideways Detector indicator automatically spots sidelined or neutral market trend conditions. It helps you to avoid trading during choppy markets. Also, it highlights the sideway market ranges so that you can determine potential price breakout levels. We also recommend looking into the N-Bar Reversal Detector Indicator and the Range Detector Indicator, complement the Sideways Detector perfectly by providing additional insights into reversal and range conditions. Personally, I found the indicator especially useful when paired with trend filters like a moving average — this way, I only acted on breakouts in the direction of the major trend. It saved me from many false breakouts and improved my overall strike rate. For me, the biggest benefit was psychological: I stopped forcing trades in uncertain markets because the indicator visually reminded me to wait for clean setups In financial trading, the price usually initiates fresh trend moves after breaking the high or low of a sidelined market. Such breakout moves enable traders to take advantage of current market momentums and transform them into potential trend-following trading opportunities. Therefore, besides determining on-trend price conditions, it is also essential to watch the sideways markets. However, monitoring the chart all day long to spot such price conditions is quite time-consuming. So, having an MT4 indicator like Sideways Detector is always beneficial for scalpers and intraday breakout traders. After reading this guide, you’ll learn how to apply Sideways Detector in MT4 for detecting sidelined markets and identifying potential breakout trading signals. How to determine breakout trading signals by using Sideways Detector in MT4 The Sideways Detector constantly monitors the highs and lows of the price candles for spotting flat market trends. It highlights the areas using a blue rectangle whenever the price initiates moving within a shorter range. It indicates the price is currently flipping within the rectangle and yet to decide the direction of its upcoming trend. Depending on the market sentiment, the price may break out of the sideways range either way. , Activate buy orders when the price turns above the blue box, plotting a bullish breakout. And go for sell entries when the price makes bearish breakout by moving below the box’s low. Sometimes you may encounter false price breaks at the edge of the rectangle, causing losing trades. Although, you can still improve your winning rate by considering entries plotted only within the current trend direction. For instance, look for bullish breakouts only for placing buy orders during uptrend market conditions. Moving averages, MACD, and high-low methods are the most effective tools for identifying market trends. Besides, you may add pivots, support/resistance, and trend lines to spot strong price breakouts. Pros and Cons of the Sideways Detector Indicator ✅ Pros Clear visualization of flat markets: Blue rectangles make it easy to identify no-trade zones. Saves time: Automates the process of spotting choppy price action so traders don’t have to monitor constantly. Great for breakout traders: Helps anticipate strong moves after range conditions. ❌ Cons False breakouts possible: Needs confirmation with trend filters or price action. Not a stand-alone tool: Works best when paired with other indicators like MA or MACD. Less effective on very low-volume markets: Ranges may appear but not lead to meaningful breakouts. Conclusion The Sideways Detector is an easy-to-use MT4 indicator that offers tremendous technical advantages, especially for beginners with less trading experience. The primary goal of detecting a flat price trend is to anticipate the possible price breakout levels. In that regard, Sideways Detector perfectly highlights the true price range during sidelined market periods. Moreover, it suits multi timeframes of the Metatrader platform, allowing you to look for potential price breakouts in MTF charts simultaneously. From my own experience, this tool is best when combined with a structured trading plan that uses trend confirmation. To deepen your understanding of how institutional concepts align with breakout trading, I recommend reading our blog article on Smart Money Concept. Frequently Asked Questions (FAQ) 🎨 Does the Sideways Detector indicator repaint? No, once a rectangle is plotted, it stays fixed until the market breaks out of the range. 📊 What timeframe works best with this indicator? It works across all, but M15 to H1 are most effective for intraday breakout traders. ✨ How do I avoid false breakouts? Combine it with trend filters like Moving Averages or MACD and confirm with price action. 🔰 Can beginners use it easily? Yes, the visual blue rectangles make it beginner-friendly and intuitive. 💰 Is it useful for swing trading? Yes, though it’s more commonly used for scalping and intraday setups, swing traders can also apply it on H4 or daily charts.
1-2-3 Pattern Indicator
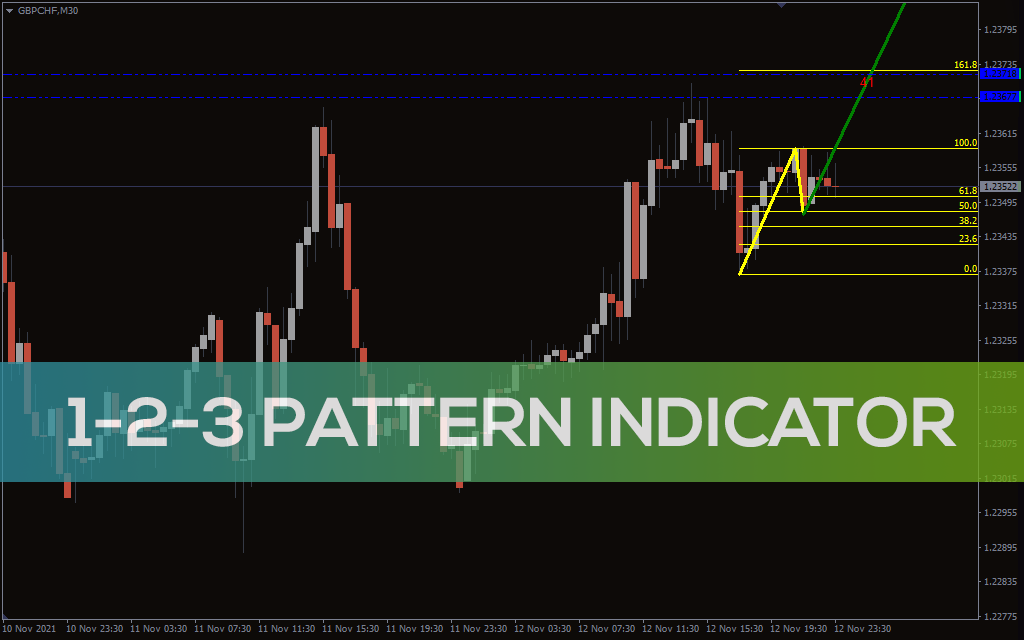
Baixe o indicador Padrão 1-2-3 gratuitamente. Descubra a tendência do mercado com os cinco indicadores Padrão 1-2-3 de nível Fibonacci.
100 Pips Indicator
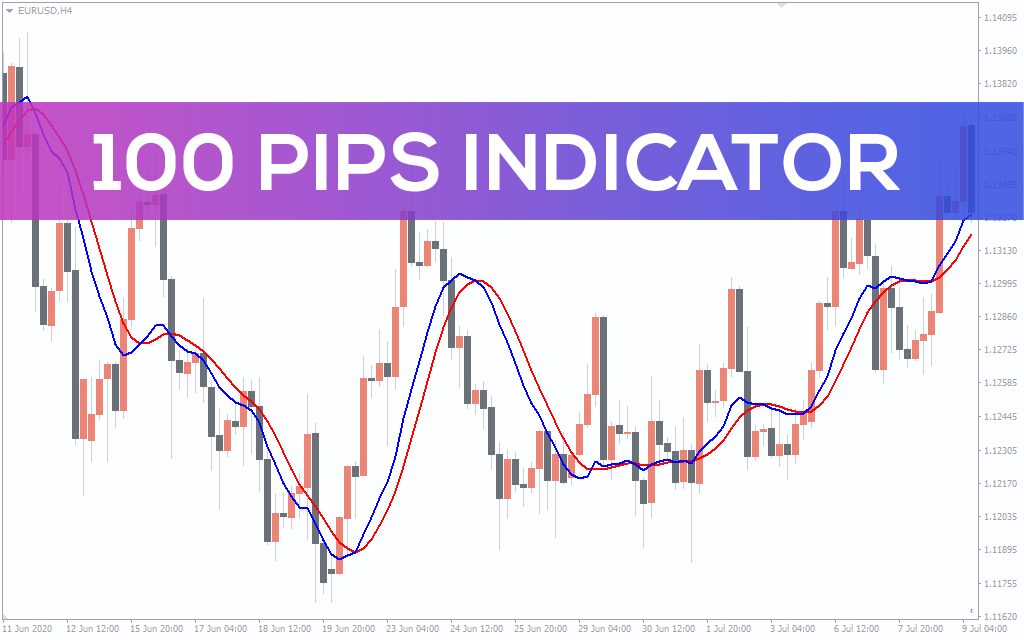
Um indicador de sinal de COMPRA VENDA de acompanhamento de tendências para comerciantes forex e de ações/intradiários. Adequado para gráficos MTF e todos os tipos de estilos de negociação no MT4. Baixe grátis.
3 Level ZZ Semafor Indicator
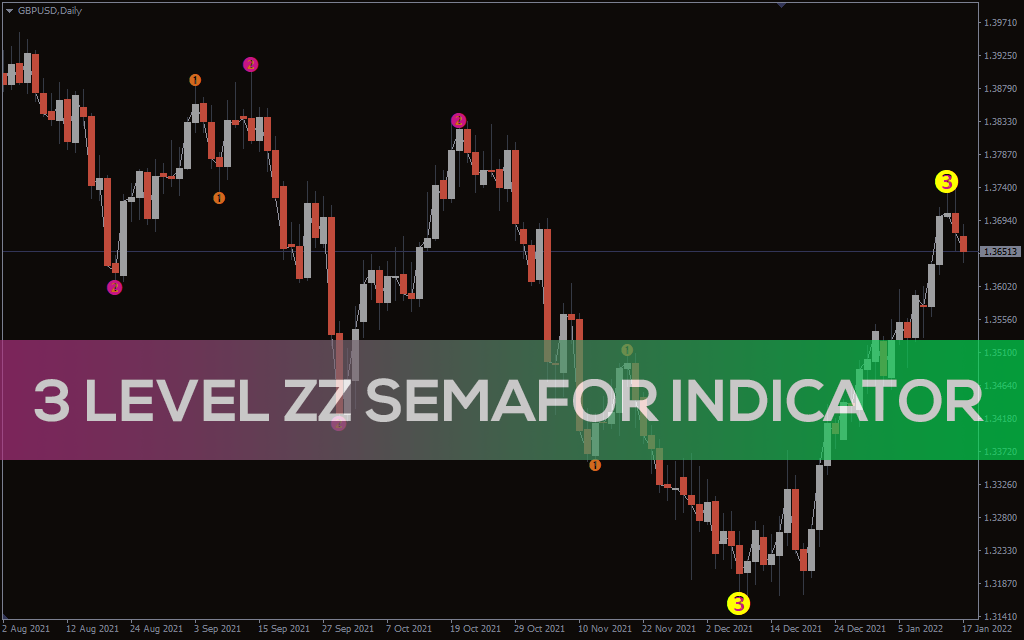
Sinais Forex BUY SELL do melhor MT4. Indicador ZZ Semafor de 3 níveis. Baixar grátis. Indicador de tendência em ziguezague.
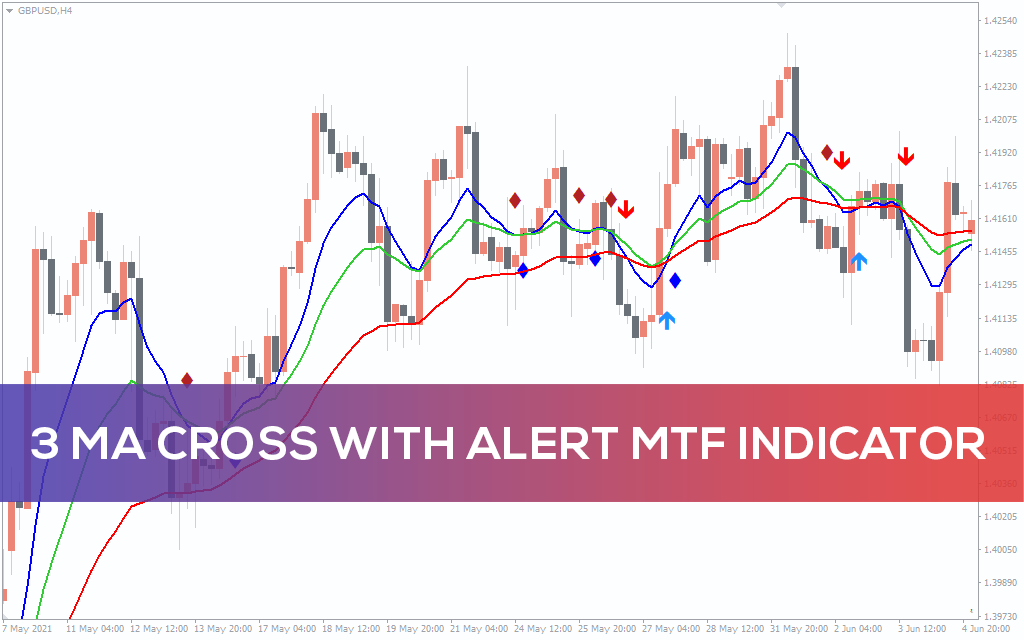
3 MA Cross with Alert MTF Indicator
Sinais Forex BUY SELL do melhor 3-MA Cross com Alert MTF Indicator. Baixar grátis. Encontre cruzamentos de alta e baixa. Indicador de tendência preciso.
Informações