
Support and Resistance Power Indicator
Support and Resistance Power Indicator For MT4 uses the highest high and lowest low to plot forex support and resistance. Useful for technical analysis.
Grátis · Sem cadastro obrigatório
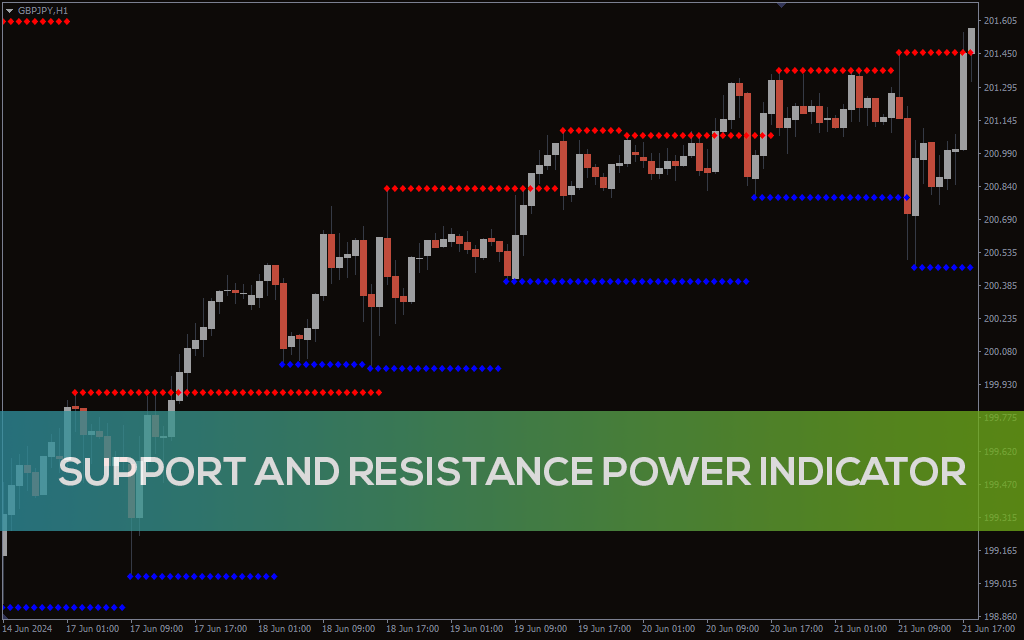
The Support and Resistance Power indicator for MT4 identifies the highest high and lowest low to mark them or resistance. This indicator does not use any other calculations other than the high and low of the price. So, it is effective in providing the best forex support and resistance. The indicator works well in intraday chart time frames daily, weekly and monthly price charts. So, it is effective for short and long-term forex technical analysis and trading strategies. Since this is simple line based indicator it is useful for new and advanced forex traders. Moreover, this helps new forex technical traders to avoid discretion in identifying the support and resistance. Support and Resistance Power Indicator For MT4 Trade Setup The indicator draws red dotted lines for the resistance and blue for the support line. By default the indicator checks for the highest high and the lowest low for a given period in the indicator settings. These highs and lows are marked and support on the price chart. During an uptrend, traders can enter the market with a buy trade above the support line and place a stop below the support. The best method is to book profit at an opposite trading signal. Similarly, traders should consider a sell position below the resistance line with a stop above it. Conclusion In summary, the Support and Resistance Power indicator for MT4 automatically plots the support and resistance. This helps new forex traders to avoid discretion and determine the levels based on highest high and lowest low of a given period.
Advanced Supply Demand Indicator
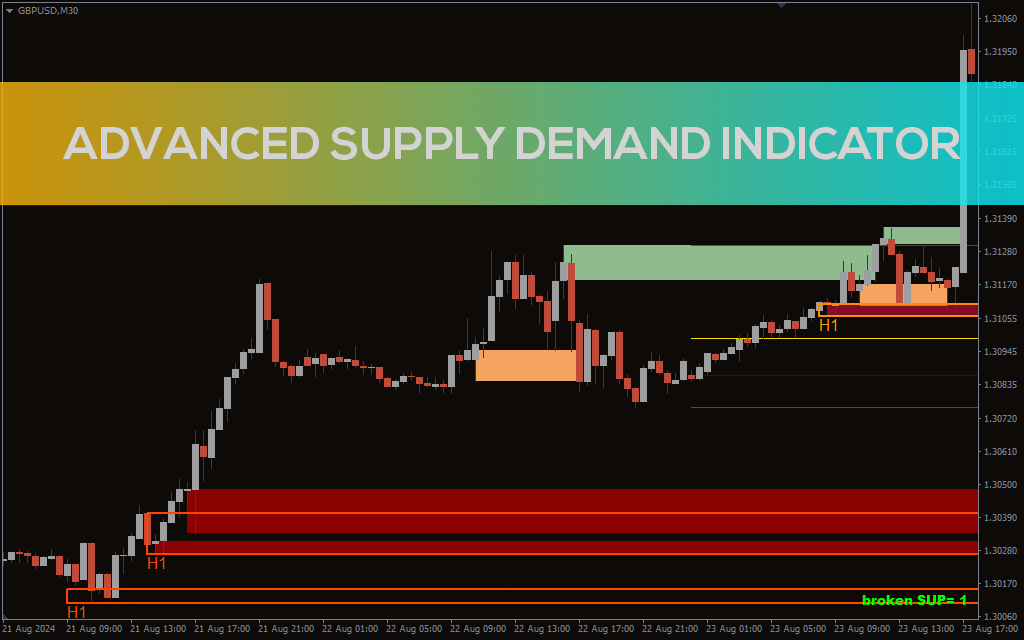
O Indicador Avançado de Demanda de Oferta para MT4 identifica zonas críticas de oferta e demanda, ajudando os traders a tomar decisões informadas, destacando as principais áreas do mercado.
ATR Ratio Indicator
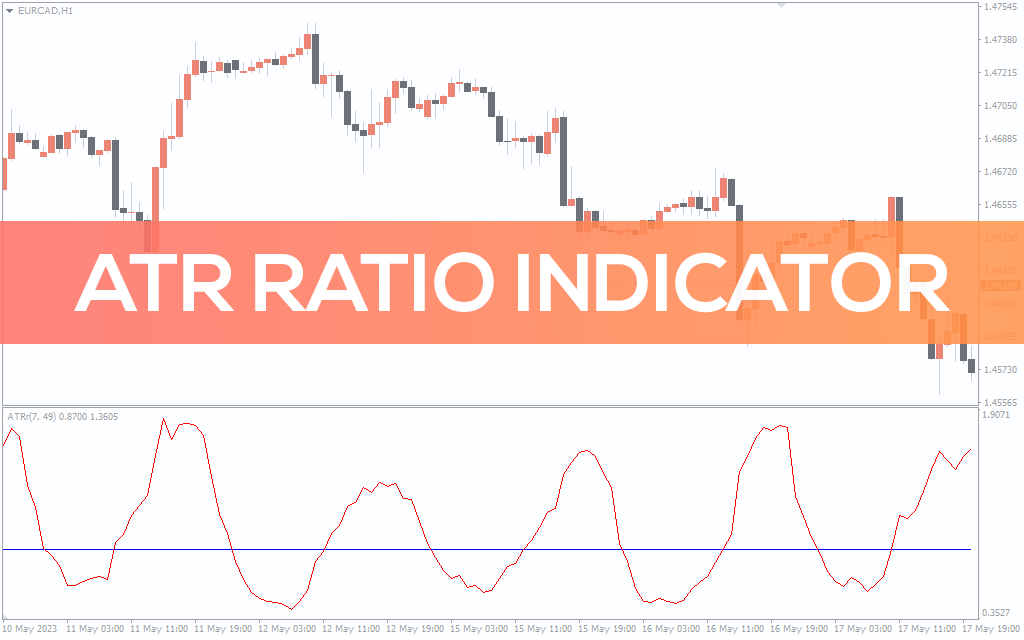
O indicador ATR Ratio para MT4 exibe o aumento e a queda na volatilidade de um instrumento. Baixe grátis! Não repintar!
Average Daily Range (ADR) Indicator
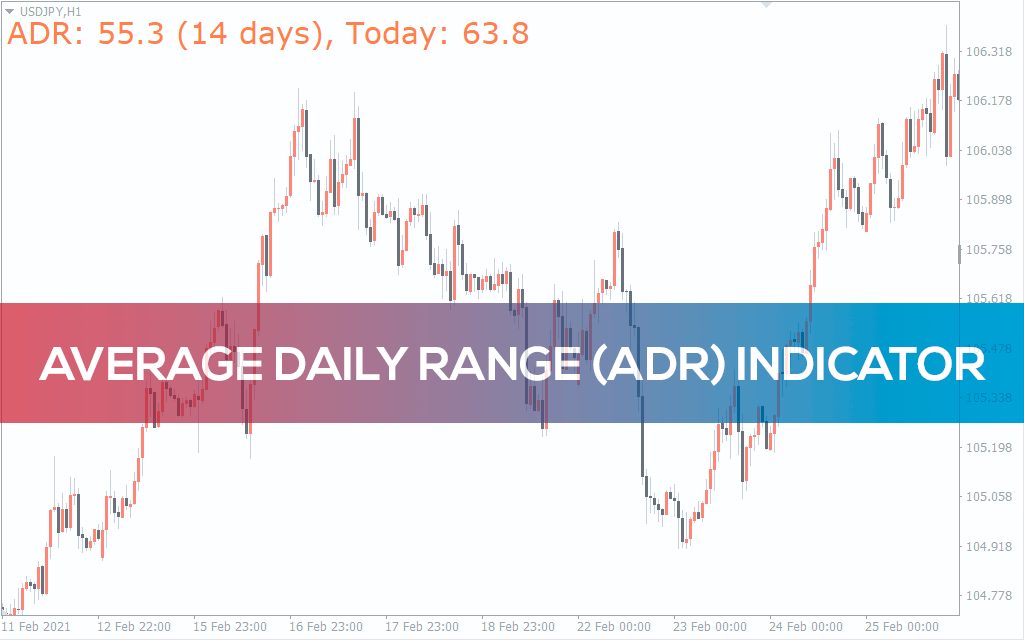
O indicador Average Daily Range (ADR) mostra o intervalo médio de um par de moedas em pips durante 14 períodos de dias.
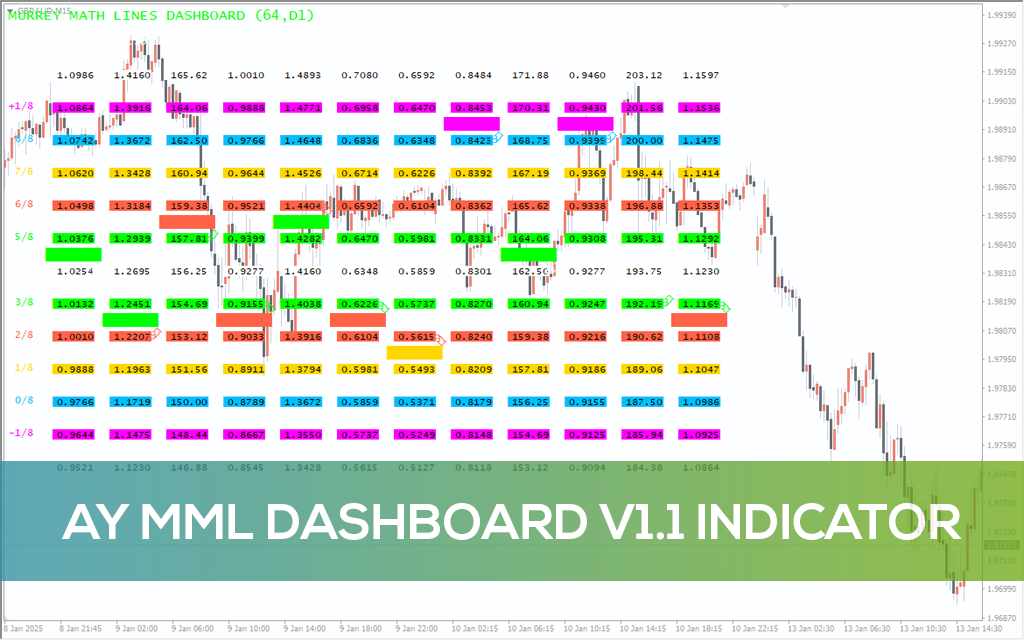
AY MML Dashboard V1.1 Indicator
Aprimore suas negociações com o AY MML Dashboard V1.1. Esta ferramenta abrangente aplica Murray Math Lines a vários símbolos e intervalos de tempo, fornecendo informações claras
Informações