
TDI Indicator for MT5
Ideal TDI indicator for sell and buy signals
Grátis · Sem cadastro obrigatório
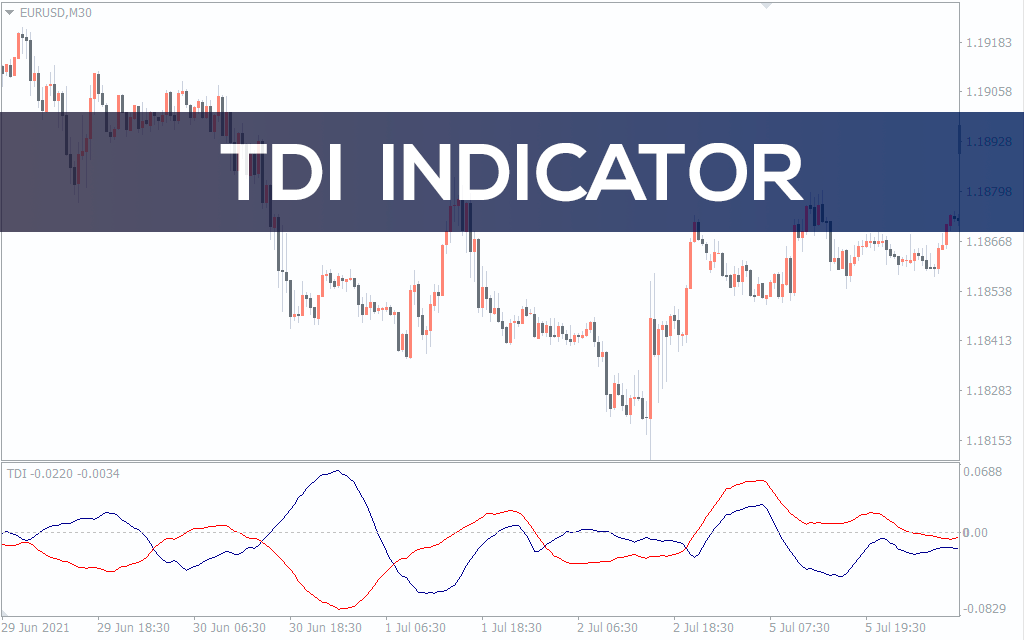
The Traders Dynamic Indicator (TDI) was developed by Dean Malone. It is based on the Relative Strength Index (RSI), moving averages and the Bollinger Band. Integrated indicators provide excellent trading signals and a clear picture of the market movement. TDI indicator for MT5 – free download, displayed in a separate window under the price chart and consists of green and red lines. The green line is known fast line and the red line is the signal line and is calculated using a longer period. Essentially, the two lines represent the strength and volatility of the market. Investors receive trading signals when two lines cross. Apart from the two RSI lines, the TDI indicator also has a simple discrete histogram that shows the preferred trading direction. TDI Trading Signals Basically, you have to wait for the red and green lines to cross. A buy signal occurs when the green line crosses the red line from below.\ For buy positions, put your take profit at the next resistance level or when the green line crosses the red line from above. Conversely, if it crosses the red line from above, this is a clear sign of a sell signal. For sell positions, put your take profit at the next support level or when the green line crosses the red line from below. Moreover you can see the additional signal by the indicator's histogram. When the histogram changes color to green it is a sign to open a long position. Oppositely, when the histogram changes color to orange, you can open a short position. Exit Strategy For buy positions, take profit at the next resistance level or when the blue line crosses the red line from above. For sell positions, take profit at the next support level or when the blue line crosses the red line from below. TDI Chart Example The above chart shows the GBP/USD price movement on a hourly timeframe. The green line crosses the red line from above ((shown by the red circles). Similarly, the price rises when the blue line crosses the red line from below. In addition to the crossover of the TD Index and Direction lines, changing their direction Direction line crossing zero, can also be signals for opening a position in the direction indicated by the histogram Conclusion The Traders Dynamic Index is a great tool for identifying buy and sell signals. Basically, you only have to wait for the line to be crossed and enter your positions. Remember that the indicator combines RSI, moving averages and Bollinger bands indicators. This means that you can use the indicator standalone strategy. However, it is wise to combine with other strategies to get better trade entries.
3 Color MACD Indicator for MT5
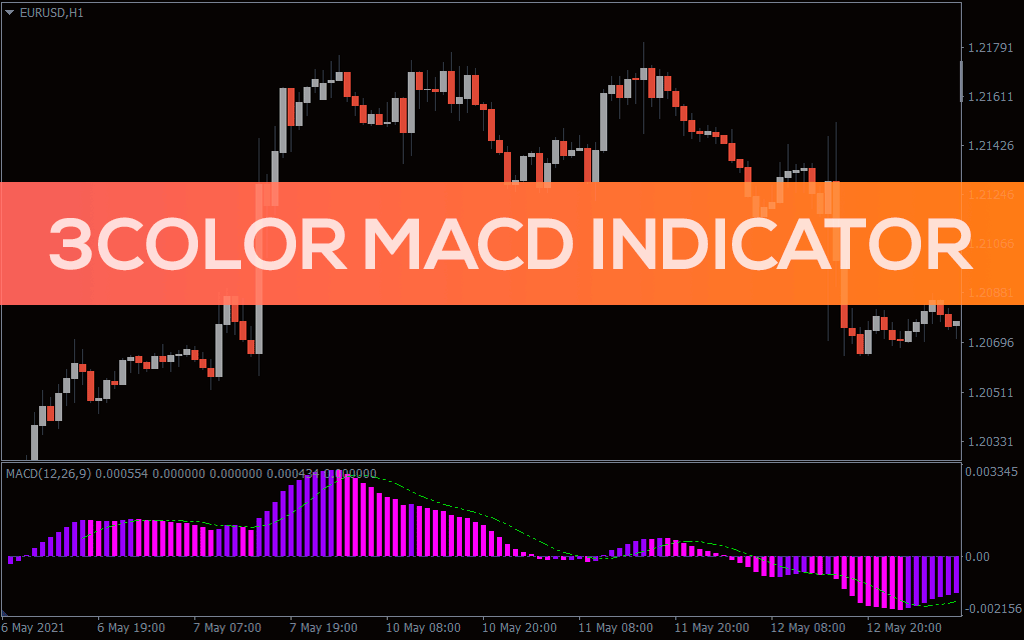
3 Colored MACD Histogram Indicator for MT5 Best forex trading indicator with MACD lines and histogram
3TF RSI Average Indicator for MT5
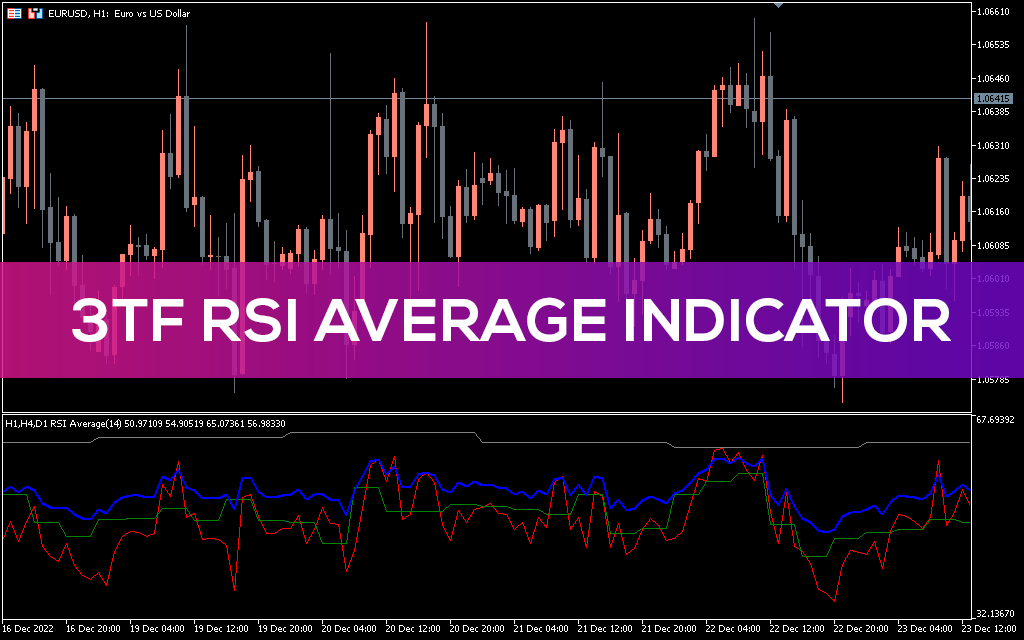
3TF RSI Average MT5 Indicator it is great trading tool to combine RSI and multitimeframe methods
4 MA Strength Indicator for MT5
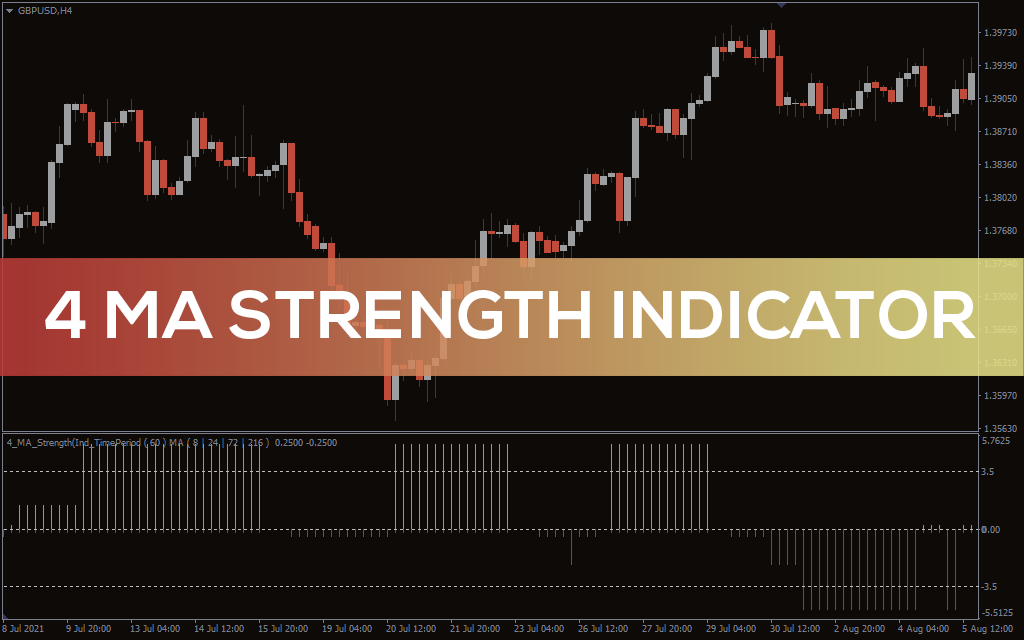
Forex BUY, SELL signals from the best 4-MA strength indicator
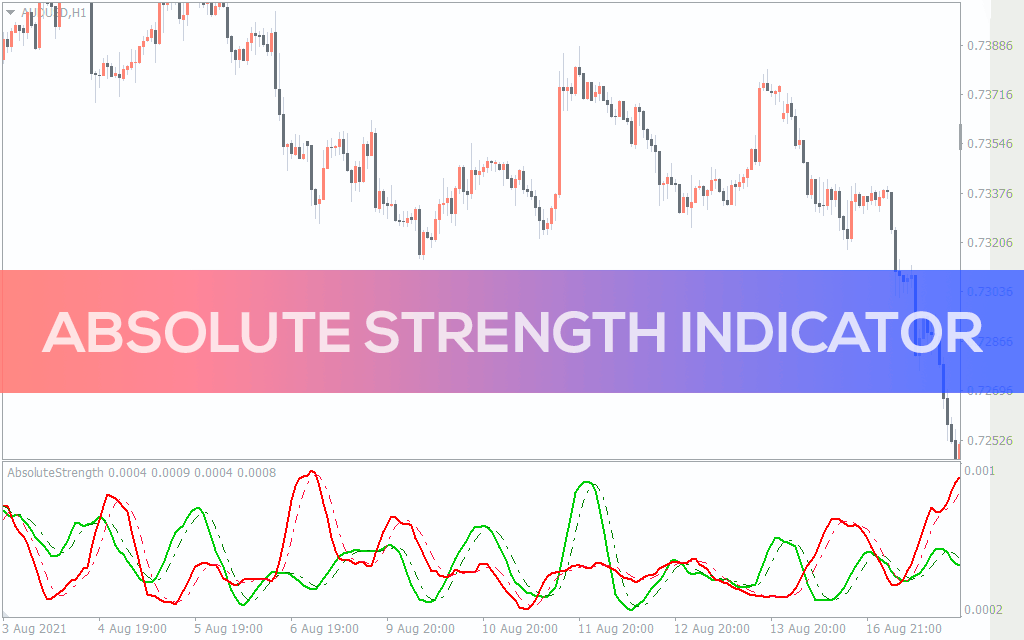
Absolute Strength Indicator for MT5
Absolute Strength Indicator for MT5 gives you BUY and SELL trading signals and trend strength
Informações