
Trendline Indicator for MT5
Trendline Indicator is the best dynamic trendline indicator for MT5 platforms
Grátis · Sem cadastro obrigatório
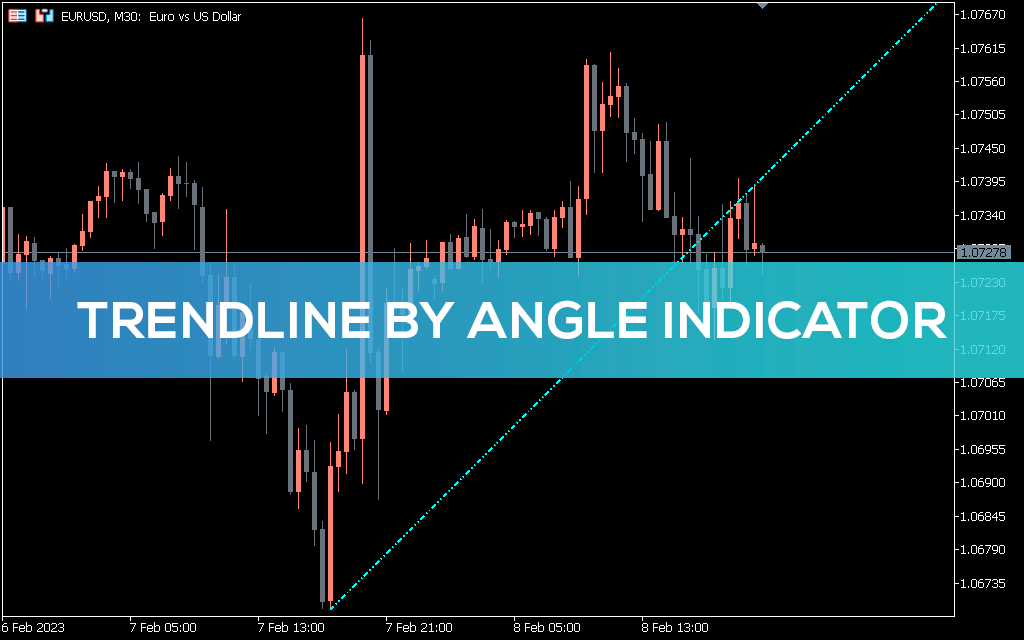
Trendline is an automatic trend line indicator for the MT5 platform. It does not draw straight trend lines. Instead, it uses least square moving average (LSMA) to find dynamic price trend lines. Finding the correct market trend is the main task of the Trendline indicator. Moreover, it shows the dynamic support and resistance of the market in real time. As a result, you can use it to identify potential delayed entry levels in the correct direction of the trend. Moreover, the Trendline indicator helps filter price action patterns and evaluate the likelihood of success of a trade setup. For example, a price breakout or bullish pin bar in the direction of the current trend has higher profit potential than a move against the trend. Additionally, the Trendline indicator can be used to improve the performance of your Expert Advisor (EA). You can tell your advisor when to trigger an entry once price finds true support/resistance in the trendline area. Trendline is a MA-based indicator without redrawing and does not support fractal-based trendline construction. Apart from Forex tools, this indicator is also ideal for analyzing charts of stocks, futures and cryptocurrencies. How to trade within the trend using the Trendline indicator? This indicator uses two lines to plot a dynamic trend line. It changes color from blue to red to show changes in the direction of the market trend. The indicator is blue when the trend is bullish and turns red when the trend switches to bearish. As a trader, you must first determine the current trend status. Then wait for price action signals near a trend line level that supports the current trend direction. Alternatively, you can place an MT5 alert near the trendline area to be notified whenever price approaches the trendline area. In the example above, the price broke above the trend line support at the top of the chart. Later, the trend line turned red, confirming the bearish trend of the market. Also, the price failed to regain its position above the support of the trend line. According to the trendline trading strategy, this is the ideal setup for entering a sell position. Additionally, you can use other candlestick or chart patterns such breakout, price breakout, triangle pattern to identify post-trend market entry. When trading with the Trendline indicator, you need to remember two rules: The price action signal must be plotted near the current trend line level. The price action signal and the market trend must follow in the same direction. For example, the price makes a false breakout of dynamic support and rises above the trend line level. Now, if the indicator is blue, which confirms the bullish trend, then it may be ideal to open a buy order. On the other hand, it may be unwise to go short after a bearish price breakout while the market trend is bullish. Conclusion Trendline is a useful MT5 indicator for analyzing market trend and price support/resistance. It works best when applied to a Forex currency chart, but is also ideal for trading stocks, futures and other online trading assets.
Absolutely No Lag LWMA Indicator for MT5
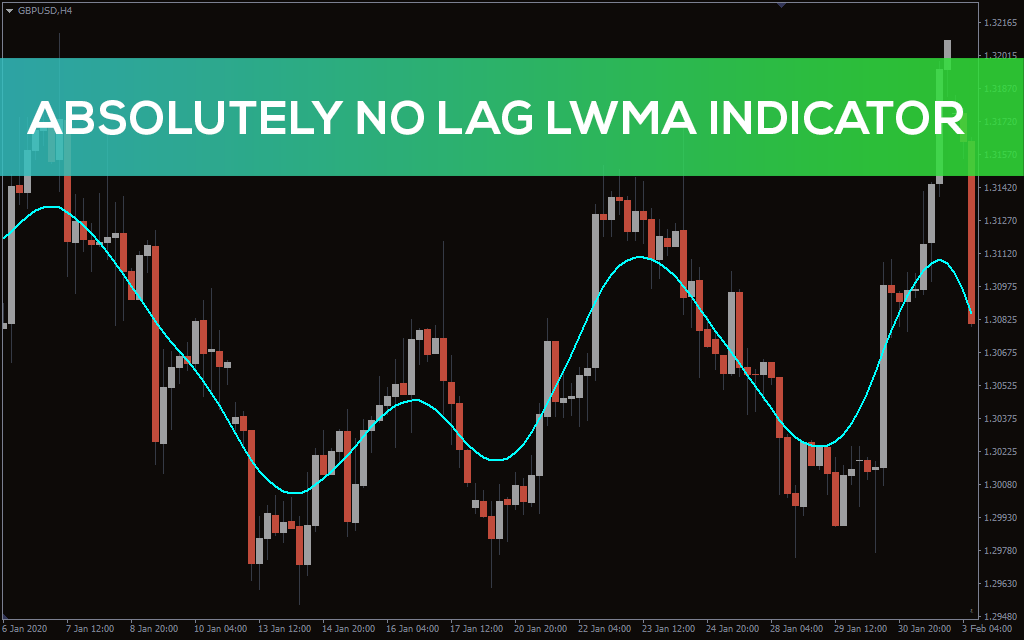
The best Absolutely No Lag LWMA moving average indicator for identifying correct market trends on MTF MT5 charts
Advanced Fractals Indicator for MT5
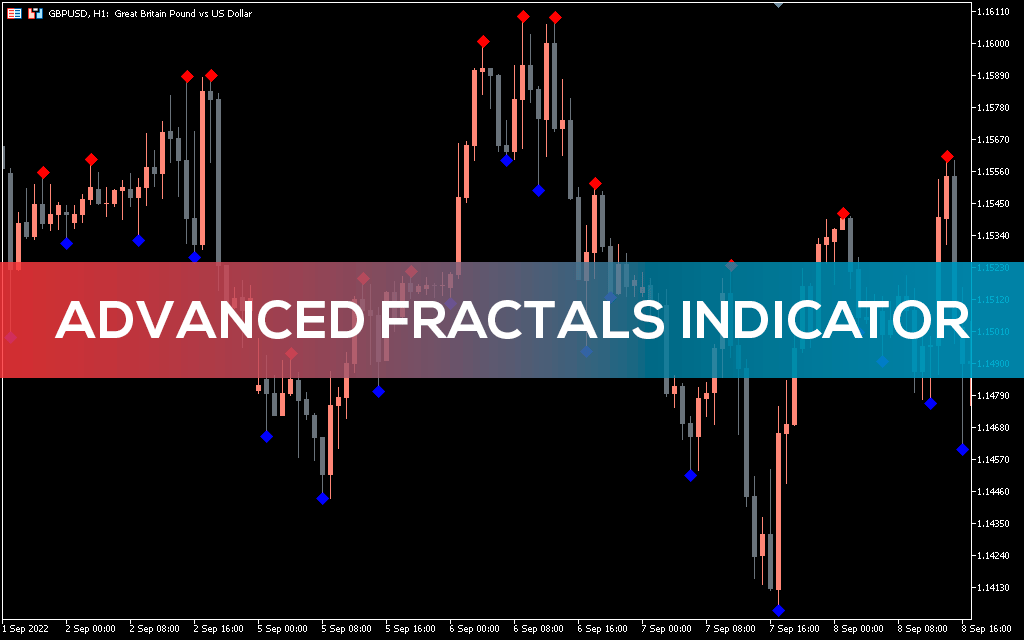
Learn about the best ways to use Advanced fractals signals for profitable Forex trading
ADX Buy Sell Indicator for MT5
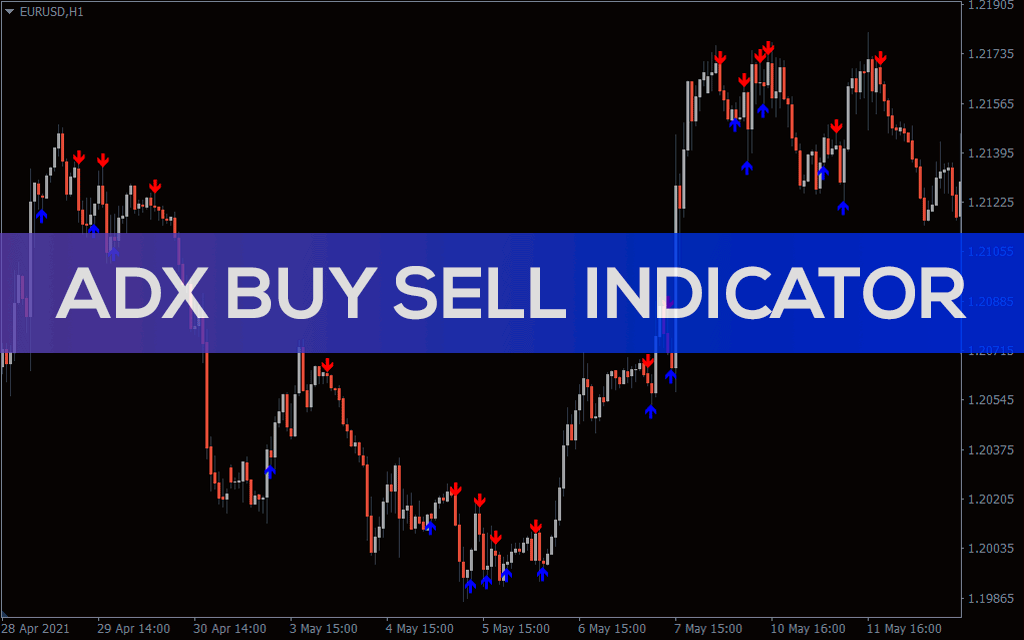
ADX Buy Sell MT5 forex trading indicator
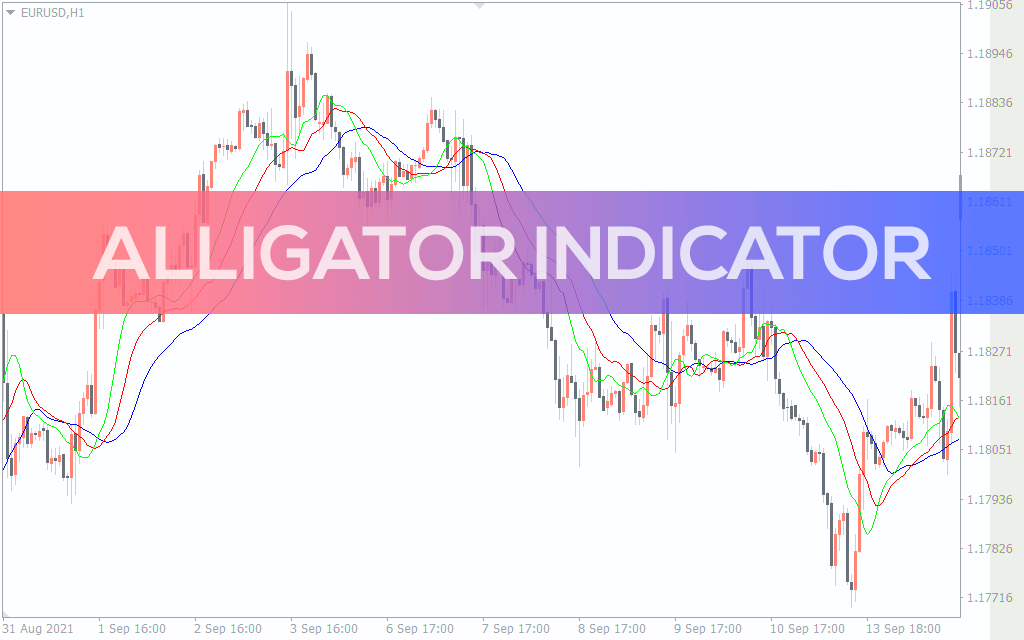
Alligator Indicator for MT5
Alligator is one of the best alternatives for moving average indicators
Informações